Breakeven point analysis-graphical approach
Breakeven point is a tool that is useful in any business, be it small, medium or large. The in depth analysis of this business model is helpful in providing an insight of the business.
Cost Volume Profit (CVP) Analysis
CVP analysis is also referred to as break-even analysis and it is an in depth interrogation of the relationship between cost, volume and profit levels of a business at a particular period in time.
Further analysis
1 .Volume
Volume is the units produced per machine run. It is the total output produced in a day, week, monthly or per annum. Again, the total number of units produced depend on the production capacity of the machinery used
Volume and Economies of Scale
Economies of scale is the advantages derived by an entrepreneur for producing goods in large quantities. One of those advantages is that the more one produces a particular product, the cost keeps on reducing up to a certain level beyond which the cost starts to increase. Graphically, this approach is represented as follows;
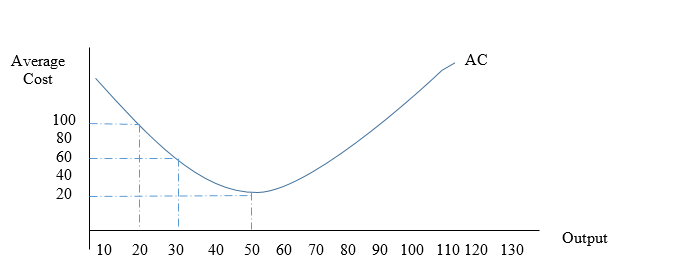
When output is at 20 units, the average cost is $100. As the firm produce more, i.e up to 30 units, the average cost reduces to $60.
It is at 50 units level of output that the average cost is at the lowest, that is $20.
Any higher level of production beyond 50 units will result to diseconomies of scale as far as cost is concerned for the average cost will start increasing.
2.Cost
Cost is the economic value of the inputs used in production of goods and services. It is the expenses incurred or paid for to acquire the raw materials needed in production.
Cost is classified in to two;
Fixed cost-is cost which is constant or which does not change with changes in the level of output. For example, we have monthly salaries for employees and rent which will have to be paid by the business whether production is zero or otherwise.
Variable cost-is cost which change with changes in the level of output
Variable cost is a derivative compound of number of units of input needed for production and the cost per unit of those inputs. In other words, total cost is a product of cost per unit multiplied by the number of units used for production. In short, total cost compose;
Cost per unit (ie C/U)
Total units produced (Units)
3.Profit
Profit is the excess of sales over cost. In other words, when sales value is more than cost value, is the time we talk of profitability.
Profit is a derivative of selling price and units sold or the level of demand
That is;
Selling price
Units sold
Cost, volume, Profit relationship
When volume of production increases, total cost increase and profitability increases. Therefore, there is a direct relationship among the three variables
Example one
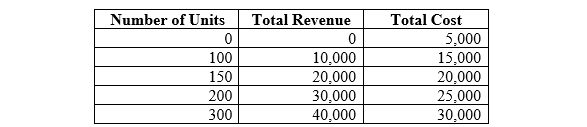
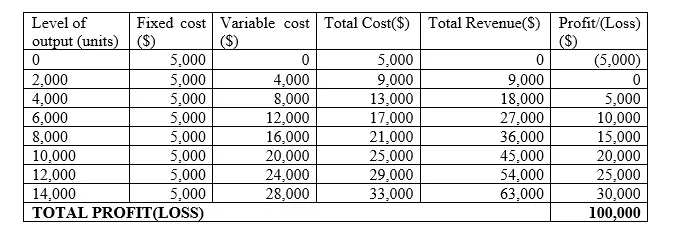
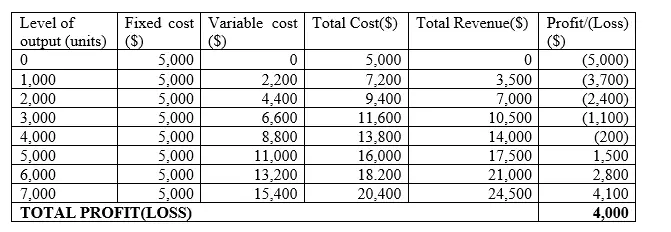
Hosanna co. ltd produces juices for the market in its environs. The selling price and cost is $60 and $40 per unit respectively. Assume that all units produced were all sold. The following data was extracted from the production schedule
Required
i)Using the above table, determine the breakeven point in terms of units, revenue and cost
ii)Using graphical tool, determine the breakeven point in terms of units, revenue and cost
iii)Comment on the relationship between volume, cost and profitability factors
iv)From answer (i) and (ii) comment on the two answers
Solution
i)From the table, it is possible to identify the breakeven point. In this case, the breakeven point is when the sales revenue and total cost is the same. In this case, 20,000 is the breakeven point and at this point the breakeven units is 150
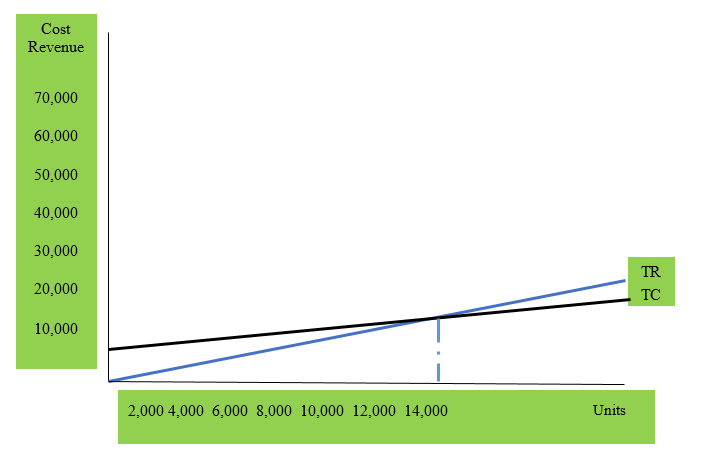
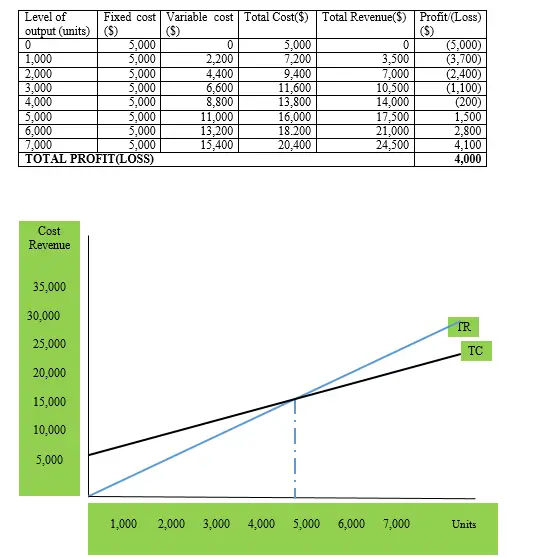
ii)Graphically, breakeven point is determined as follows;
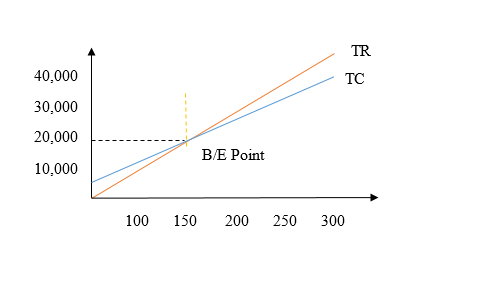
Similarly, from the graph above, it is possible to identify the breakeven point. In this case, the breakeven point is at a point where the TR and TC curves overlap one another and at this point the sales revenue and total cost is the same. That is, 20,000 is the breakeven point and at this point the breakeven units is 150.
iii)There is a direct relationship between volume (units), cost (total cost) and profitability. For as the volume increase from 0 to 150 and so on, the total revenue and total cost are both increasing and profitability is increasing although in the beginning there were losses which turned into profits after breakeven point
NB1: Before breakeven Point
Both total revenue and total cost are experiencing an increasing rate. However, TC rate of increase is more than the TR rate of increase. This makes the business suffer losses (TR<TC)
NB2: At breakeven Point
Both total revenue and total cost are experiencing an increasing rate. But at the breakeven point, the rate of increase for both TR and TC is the same. Therefore, at this point the business is not making any profit or loss (TR=TC)
NB3: After breakeven Point
Both total revenue and total cost are experiencing an increasing rate. However, TR rate of increase is more than the TC rate of increase. This trend is the reverse of what was happening before breakeven point. This makes the business enjoy profits (TR>TC)
iv)The two answers are the same. This means the two models (ie table and graphical) represent the same concept
Assumptions of breakeven point
For breakeven point model to function, the following are the key assumptions;
- It is possible to separate fixed and variable cost
- Fixed cost is constant at some period of time
- Variable cost is constant at some period of time
- Selling price is constant at some period of time
- Only one product is under consideration
Is breakeven point applicable in decision making for a small and medium enterprise (SMEs)?
The answer is YES
This is because the model can be used in the following decision making aspects;
- Pricing Policy
- Output Optimization
- Adoption of Technology
- Business Margin of Safety
EXPLANATION
Breakeven Point and Pricing Policy
Pricing policy is the decision made on the level at which to set the selling price of the product so as to gain competitive edge among other competitors in the same industry.
If the prevailing market price is high for the final consumer of the product, the management of SME or any other business can adjust the selling price to ensure that the price is attractive by making the product cheap. This is applicable when the price elasticity is high (sensitive).
Step by Step price adjustments
Step 1;
Assess the demand level of the product in question. If the demand is low below average or expected, it means the prices are not attractive (holding other factors ceteris peribus or constant)
Step 2;
Based on the breakeven point model, adjust the prices downwards so as to increase sales level (ie demand level).
Step 3;
Compare the total revenue generated with the total cost incurred after adjustment to determine if the business is break evening or not
Step 4;
Keep on adjusting the prices up or down until the demand for the business product is high enough to compete other firms
Example
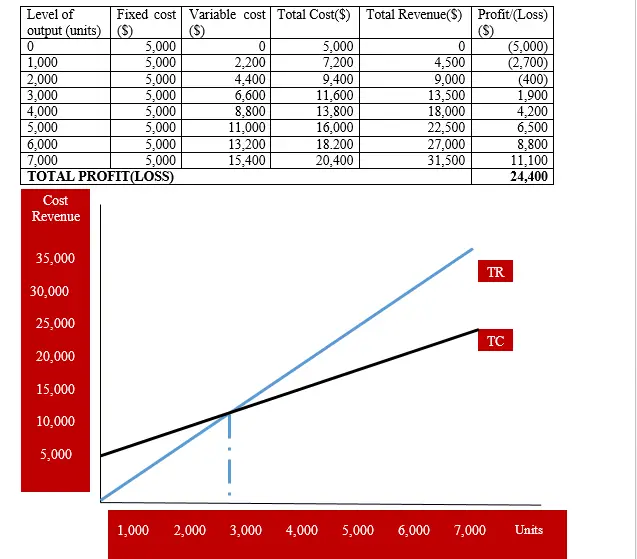
Hard Rock co ltd provided you with the following cost and demand schedule for its product “R” for the month of June 2020. Variable cost and selling price per unit was $2.00 and $3.50 in that order
From the information provided, the management felt that it was necessary to work on a new pricing policy so as to increase the market share of the firm
Suppose the following pricing policy which involved adjustment of selling price as follows
;i)Increased from $3.50 to $4.50, and cost remain constant
ii)Decreased from $3.50 to $2.50, and cost remain constant
(Hint-assume variable cost per unit remained the same for the period under consideration)
Required
(a)For case (i) and (ii) demonstrate graphically the outcome of the profit of the organization
(b)Compare the outcome of the two pricing policies in (i) and (ii) above and advise the management
Solution
Before increase of selling price
If selling price is increased from $3.50 to $4.50
If selling price is decreased from $3.50 to $2.50
The management should adopt the price increase policy for the profits are more as compared to price decrease policy. This could be due to the demand elasticity level of the product.
Breakeven Point and Output Optimization
Breakeven point model is useful in providing a guideline on how to optimize supply level such as sales in units which also dictate the amount of resources required to produce the final products.
That is, the entrepreneur can use the breakeven point model to assess the level of production to adopt for the firm to breakeven. This can be achieved by following three steps;
Step 1: Determine the level of production at current breakeven point.
Step 2: Adjust the selling price and assess the new level of production/supply needed to reach the breakeven point
Step 3: Take the necessary control measure to ensure optimal utilization of the resources. This can be achieved either by increasing or reducing the selling price if one is in a position of doing so.
Example
Water lily co. ltd produces animal feed, which it sells in the market experiencing high demand level. The selling price for the final product was 3.50 and the variable cost/unit of the raw materials used was 2.20. The materials used are scarce and there is need of minimizing the usage thereof without ignoring profitability aspects. The following production data was provided to you to guide the management on utilization of the raw materials.
Required
Suppose the management increased the price from $3.50 to $4.50, what will be the raw material usage implications on change in price?
Solution
The answer to this question require first we determine the current usage level of resources for as more materials are used the more the output.
Here we go….
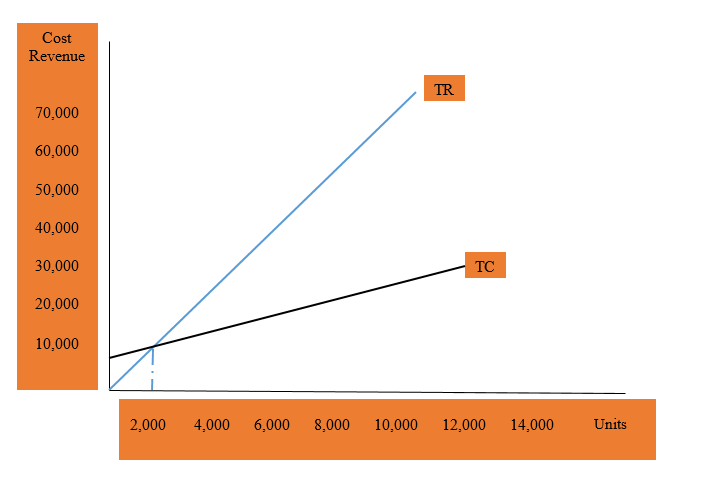
From this graph, breakeven point is reached at a point between 4,000 and 5,000 units which need to be produced and sold.
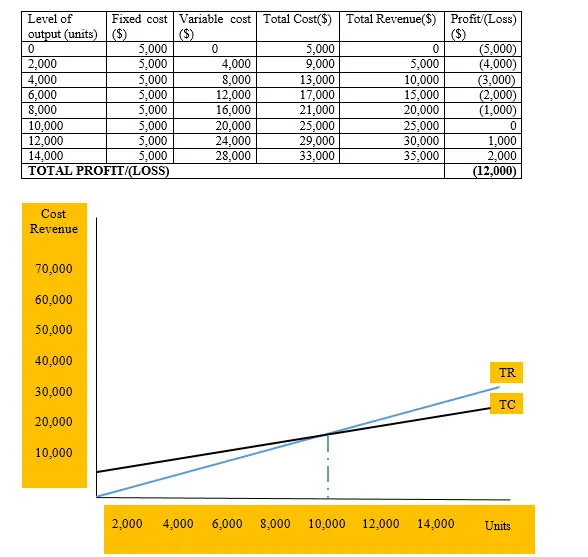
If selling price increases from $3.50 to $4.50, the new table and breakeven graph will be as follows;
From this graph, breakeven point is reached at a point between 2,000 and 3,000 units, which need to be produced and sold. This implies that with increase in selling price, the units required to reach breakeven point are fewer and hence fewer resources are required, which is advantageous to the organization.
Breakeven Point and Adoption of Technology
The cost of production incurred especially for manufacturing firms is heavily determined by the technology adopted by the organization. It is in record that the more advanced technology used in production, the cheaper the cost of production, ie average cost and the vice versa is true. Therefore, a breakeven point model can be utilized to establish whether a new technology adopted is efficient enough to minimize resource utilization.
Example
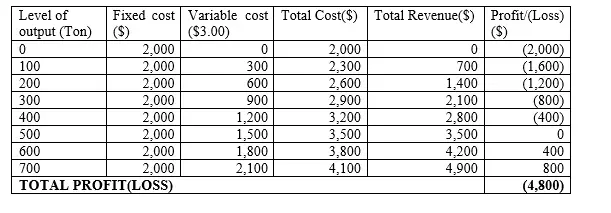
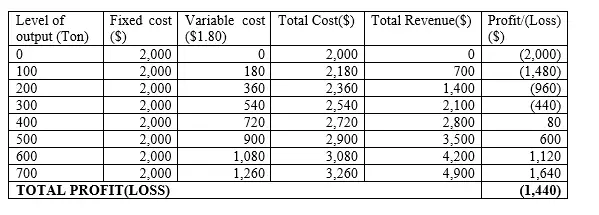
MZN co. ltd is a maize milling organization and for the last ten years, it has been using old technology in producing and packaging maize flour. The production schedule results for the last month of December 2020 were as indicated below; Hint, selling price per ton is $7.00
In January 2021, the management adopted a new and advanced technology where by more than 50% of the production processes were automated. This reduced variable production cost from $3.00 to $1.80.
Required
Advise the management if it venture is a worth course or not and justify your answer.
Solution
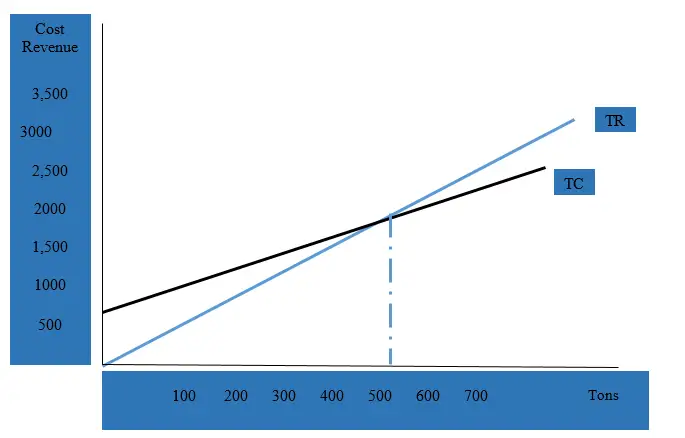
Before adoption of the new advanced technology in production, the production level for the firm to breakeven was 500 tons.
Graphically, this is represented as follows;
If the company adopts the new advanced technology, the resultant outcome is as shown in this table below and the graphical representation will be as indicated after the table
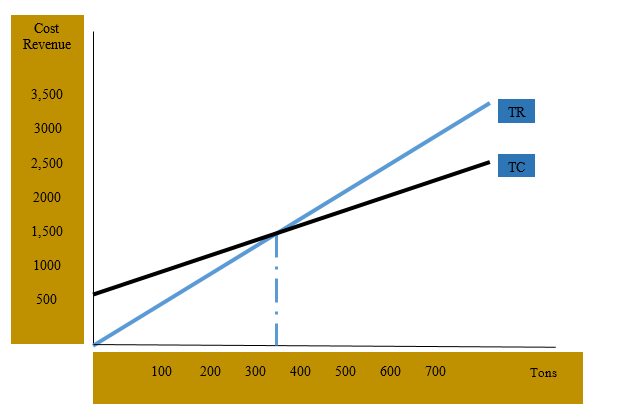
If the company adopts the new advanced technology, the level of production required to breakeven is between 300 and 400 tons from the previous 500 tons.
Advise; the management should adopt the new advanced technology for the tons required for the firm to breakeven are fewer hence more economical.
Breakeven point and Business Margin of Safety
Before pointing out the importance of breakeven point, the question that arises is what is business margin of safety?
Definition-Business margin of safety is the excess production level or output over and above the break-even point (BEP) level of production. In other words, it is the amount of sales or output that can fall before the break-even point (BEP) is reached and the business makes no profit. This aspect is graphically represented as follows;
Assume that the production capacity of the processing plant is 700 tons per week
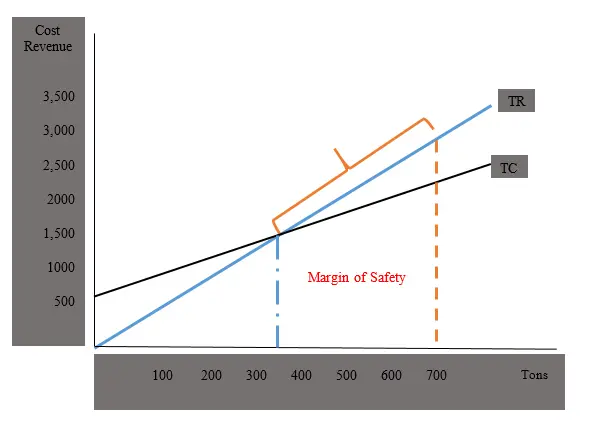
Now, breakeven point model aid in assessing the extent to which a firm can absorb production or output shocks arising from adverse factors such as drought, bad weather, workers strike or machine breakdown. Given the production capacity of the plants used in manufacturing, it is possible to know whether the firm is on the safe grounds if adverse factors strike.
Example
Shining Star co ltd manufactures pharmaceutical products using two different production lines. The production plant of line one has a production capacity of 100,000 kilograms of product X whereas, the production plant of line two has a production capacity of 70,000 kilograms of product Y. The following production schedules for the two production lines was provided to you to assess the degree of safety in case of a calamity in waiting
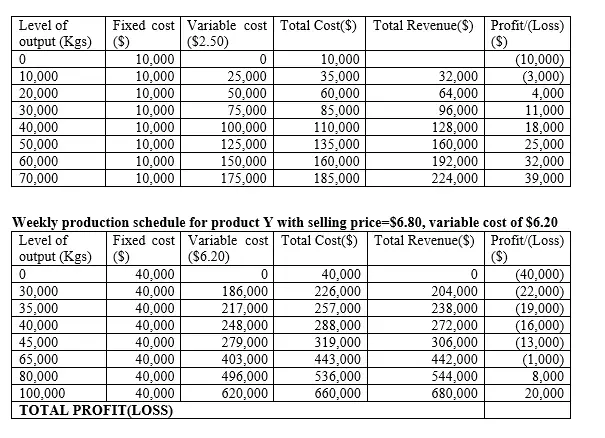
Weekly production schedule for product X with selling price=$3.20, variable cost of $2.50
Suppose in the month of May 2020, the workers went on strike and the two production lines reduced their rate of output by 40% of their capacity respectively.
Required
Determine which production line is safer to the firm
Solution
Based on the table of product X information, the plant-producing product X had the following margin of safety
Weekly production schedule for product X with selling price=$3.20, variable cost of $2.50
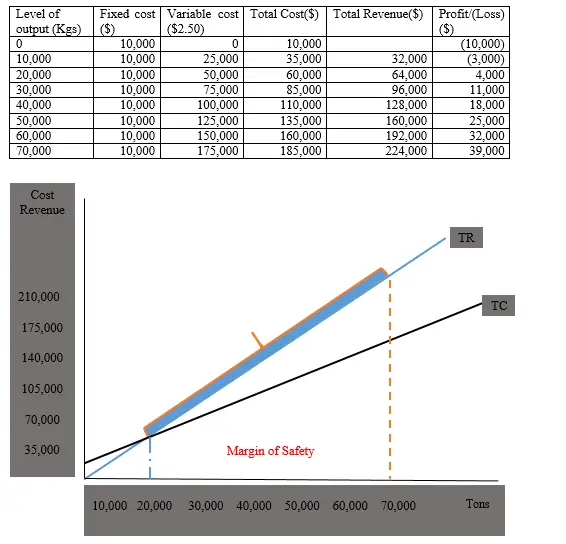
From the graph above, the margin of safety for plant producing product X is 50,000 tons (ie 70,000-20,000). Further, if production capacity reduces by 40% due to workers’ strike, then the new level of production will be
70,000-(40%*70,000)=42,000
Therefore, the margin of safety at the new level of production (42,000 tons) will be;
Margin of safety=42,000-20,000=22,000 tons
Also, based on the table of product Y information, the plant-producing product Y had the following margin of safety
Weekly production schedule for product Y with selling price=$6.80, variable cost of $6.20
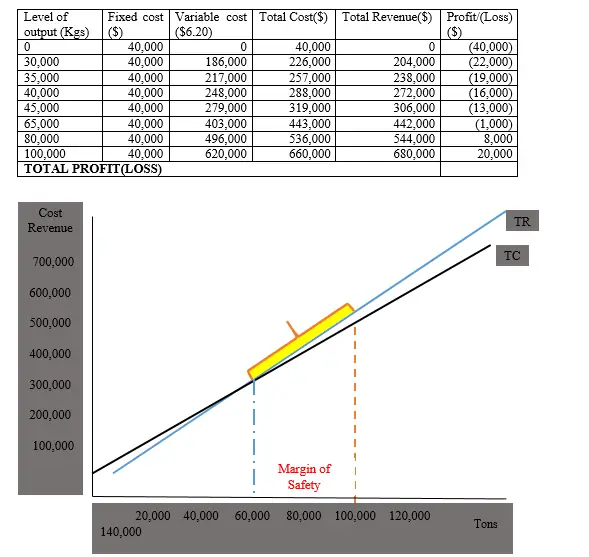
From the graph above, the margin of safety for plant producing product Y is 35,000 tons (i.e 65,000-100,000). Further, if production capacity reduces by 40% due to workers’ strike, then the new level of production will be
100,000-(40%*100,000)=60,000
Therefore, the margin of safety at the new level of production (60,000 tons) will be;
Margin of safety=60,000-60,000=0.00 tons
CONCLUSION
The plant producing product X is safer to use for it has a larger margin of safety of 22,000 tons as compared with the plant producing product Y for after strike, there is no safety.