Material inventory control procedure
Specific objectives; definition; inventory levels; demand for stock;
Safety stock stockouts; stockout costs
Specific objectives
This article is guided by the following 11 specific objectives. The learner/user of this article will be able to;
- Define the term inventory control procedure
- Identify the different levels of inventory
- Explain factors that influence inventory levels
- Compute the various types of inventory levels
- Compute EOQ level
- Ensure for accountability and transparency of purchases.
- Avoid over and under stocking of inventory.
- Accuracy in record keeping.
- Mitigate the risks of deterioration and wastage.
- Availability of inventory on demand.
- Reduction of storage cost.
Definition
Inventory control procedure is one of the five functions of management which entails estimation of levels of inventory and identification of the deviations with corrections thereof.
This managerial function is paramount as far as full utilization of the inventory resources is concerned. Again, inventory is a current asset and it represents organization’s short-term investment and care is much needed to ensure that uneconomical cash amounts is not tied in this asset. Also, the level of inventory needed to be maintained in the premises is important to ensure that there are no shortages in the market. Therefore, the purchasing or procurement manager has to strike a balance between the amount of cash to invent in inventory and the amount of inventory to retain in business. This therefore calls for application of the Trade-off theory which advocate for levels of cash and inventory to be maintained at marginal levels. That is the marginal cost of investing in an additional unit of inventory should equal the marginal revenue of keeping an additional unit of inventory. With this argument, this calls for a discussion on the levels of inventory to be maintained in the business. The level of inventory maintained by the business should ensure the aforementioned objectives are achieved.
Inventory Levels
Control of inventory entails a focus on the levels of inventory to ensure that the levels are economical. What does this mean? Many authors of this concept support the idea that the business should not maintain very high levels of inventory or too low levels of this item. This is not appropriate for what will dictate the levels to maintain is the trade-off theory (Miller and Orr, 1966). The tradeoff advocate that for a profit maximizing firm, maintenance of equal marginal benefits and marginal costs when a firm is maintaining some cash balances so as to avoid cases of impairment between liquidity and profitability. This is a mainstream factor to consider in addition to others discussed below.
Factors affecting inventory level
1). Inventory availability; for goods or raw materials which are readily available, the business can maintain low levels and if it’s a rare good, then the business should increase the levels.
2). Lead time; lead time is the time difference between the time an order is placed and the time the goods are delivered (i.e., Re-Order Period). The longer the period, the higher the level of inventory should be maintained in the business. On the other hand, the shorter this interval (order time-delivery time) the lower the level of inventory should be maintained by the business.
3). Stockholding cost; this is the storage cost of the inventory in the stores. If the cost is high, then the business should maintain lower levels of inventory. Further, if the costs are low, then low levels of stock should be maintained.
4). Demand level; high demand level of a good require the business to maintain high level of inventory and the vice versa is true.
5). Trade discount; if the trade discount is more than stockholding cost, more inventory levels should be encouraged and the vice versa is true. Note this, that the trade-off theory will apply in this case such that if the trade discount benefits are more compared to stockholding cost, more stock should be purchased (i.e., MR Trade discount>MC Stockholding).
NB: Keeping of high inventory level continues as long as the MR and MC condition indicated remain. These high levels will keep on reducing up to a level when marginal revenue will be equal to marginal cost (i.e., MR Trade discount=MC Stockholding). This will be the optimal level which obeys the trade-off theory.
6). Durability; this is the characteristic of a good or raw material being able to over stay in the organization without going bad or deteriorating. In this case, high levels of inventory can be kept. But if the inventory is perishable in nature, then it is advisable to keep low levels.
Setting of Inventory Levels
It is crystal clear that inventory levels for a business is critical and maintenance of the appropriate levels is paramount. As a matter of policy, management need to make decision on how to regulate this level. For this to be achieved, several empirical models are used for this purpose. They are as discussed below;
Maximum Stock Level
Maximum Stock Level is “The at Most Stock Level” (i.e., Actual stock Level =Maximum stock set by the management as per the highest demand requirement of the business) above which the business should not go. In other words, available stock should be the set maximum.
The Reasoning Behind Determination of the Maximum Stock Level;
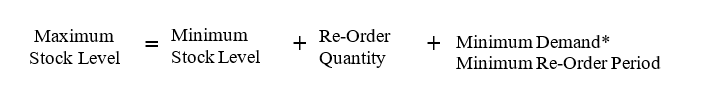
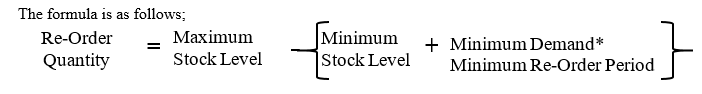
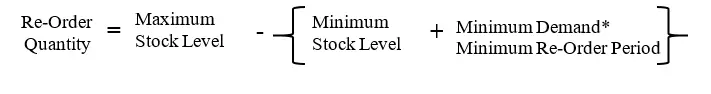
Maximum stock level is established by considering the lowest stock level the firm is expected to maintain, then add the quantity contained in the order bundle (i.e., re-order level) to be send to the suppliers as shown above for it will increase the minimum stock level. Then add the product value between minimum demand/consumption level and minimum re-order period.
NOTE that the Minimum Demand is the worst demand level we are assuming the business will experience per period.
NOTE that the minimum re-order period is the lowest time duration/deadline that the business will have to place an order (refer to lead time/re-order period. For example, if the lead time is 5-12 days, then the minimum re-order period is 5 days).
So, when you multiply the minimum demand quantity per day and minimum re-order period you will get the total minimum demand that the business expects the market to consume. A worse scenario.
Lastly, let me shade some light on Re-Order Quantity. This is total units that composes an order placed to the supplier(s) and it is assumed to be normal quantity in normal circumstances.
Minimum Stock Level (Buffer Stock)
Minimum stock level is “the lowest stock level” (i.e., Actual stock Level =Minimum stock set by the management as per minimum demand requirement of the business) below which the business should not go. In other words, the lowest available stock should be the set minimum.
The Reasoning Behind Determination of the Minimum Stock Level;
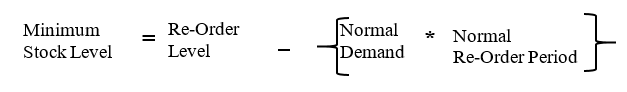
You see, to establish the minimum stock level that the business should not accept to go below, one has to consider at what level of stock does business starts to place a new order and then less total demand level (normal) of the product and expected (normal) re-order period.
But you know the information available to us is;
Maximum demand(consumption) and
Minimum demand (consumption)
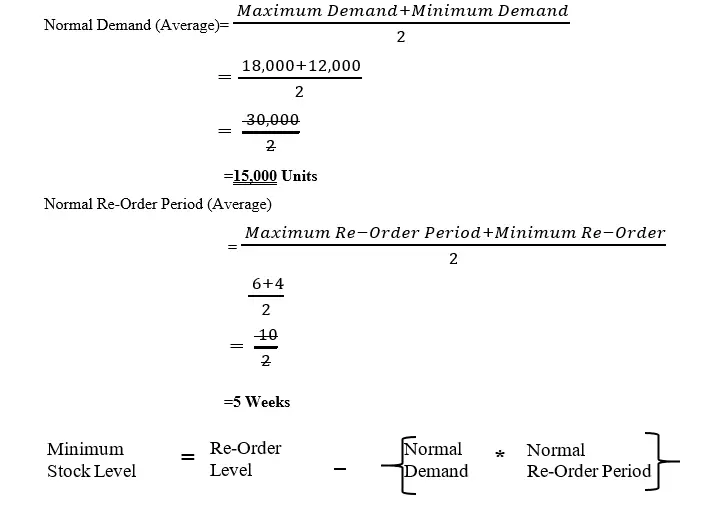
Re-order period (i.e., Lead time) which has the lowest period and highest periods of re-ordering. Therefore, normal demand (consumption) is determined by computing the average value;
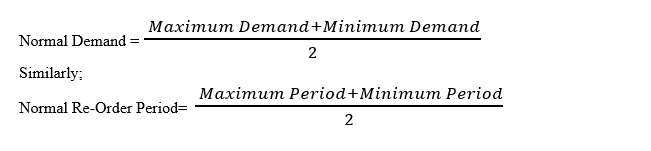
Normal Stock Level
Normal Stock Level is the average stock of a business within a certain period.
The Reasoning Behind Determination of the Normal Stock Level;
Before I present the formula for this level of stock, allow me I shade some light that will make you comprehend the concept more clearly. The term “normal” is borrowed from the discipline of finance and statistics. In statistics, we talk of normal curve or normal distribution. Mean?
Normal distribution means the “Average” and average refers to “Mean” which is one of the measures of central tendency in addition to median and mode. Further, in other words, when we talk of average or mean we actually mean the “expected”. Now in real life situation, we say “This is what is expected”. For example, when we say that the expected height of a person should be 5.8 feet high, we imply that this is common knowledge that the normal height of man should be 5.8 or there about, which is known. Anything extremely more or less than this height is termed as abnormal height.
Assuming that you have gotten the concept of normality right, when we say “Normal Stock Level”, we mean average stock level which is determined by adding the maximum and the minimum stock levels and divide by two as we normally determine average stock in financial ratio determination. Therefore, the formula for normal stock level will be given by;

NB: In other words, normal stock level is the stock level that is expected to be maintained by the business.
NB: The concept of Normality as used in cost/management and accounting is also discussed in Accountingnest.com website under the topic of “Process costing” as far as normal and abnormal loss and gain is concerned.
Re-Order Level
Re-order level is the level of inventory in the business where by when it is reached, the business must order some more inventory. This level of inventory lies between the maximum stock level and the minimum stock level. It is governed by the Re-Order Period (Lead period) which has both a minimum and maximum period interval.
This is the reason why Re-Order Level is a product of the Maximum Demand(consumption) Level and the Maximum Re-Order Period (Higher scale) as portrayed below
Re-Order Level= Maximum Demand * Maximum Re-Order Period.
So, those are the four commonly used inventory levels used in inventory control.
Re-Order Quantity
The discussion above from 1 to 4 sub-topics only focused on stock/inventory levels. However, this section is on the Quantity. Let me first define what this quantity means and then in the next discussion I will demonstrate to you the difference between stock level and stock quantity so as to be in apposition to attack questions to do with stock control if you are a student or an entrepreneur, you can apply the idea in your business.
Re-Order Quantity refers to the total number of units of a commodity that make up the order placed by the business to the supplier.
Difference between Stock Level and Stock Quantity
The distinguishing features between stock levels and stock quantity are as explained as per Figure 1.1.
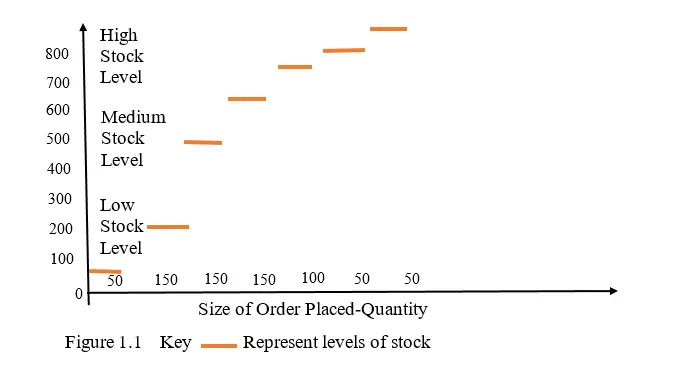
The following are the key differences based on certain aspects as per Figure 1.1
- Definition; stock level is the expression of how high or low stock variable responds to stock added or consumed while stock quantity is the number of units that form a batch or an order being placed for supply purposes.
- Measurement indicators; for stock level we use height as the methodology of gaining changes in levels such that we can talk of high, medium or low levels. While for stock quantity, we use unit of measurement such as kilograms, liters or sizes such as 10, 20 or 23.5 etc.
Relationship between Stock Level and Stock Quantity
Although we have briefly shown the difference between stock levels and quantity, they still have a correlation whereby the stock quantity determines the stock level and not the other way round. That is stock level is a function of stock quantity and the relationship is a direct one such that when stock quantity increase, the stock levels increase and the vice versa is true as shown below
SL = f(SQ).
Where;
SL is stock level (referred to as dependent variable)
SQ is stock quantity (referred to as independent or predictor/estimator variable).
Normal Procedure of Controlling Inventory in a Business Scenario
The formulas relating to stock levels and stock quantity previously discussed make no sense to many students for the applicability in the normal business set up seem to be hard. To make use of these formulas, I have briefly demonstrated using another diagram as shown in Figure 1.2 to make sense whereby for each specific formula I have demonstrated how it applies in the whole procedure of controlling inventory in a business. Look at this…
The Procedure of Stock Control in a Business Scenario
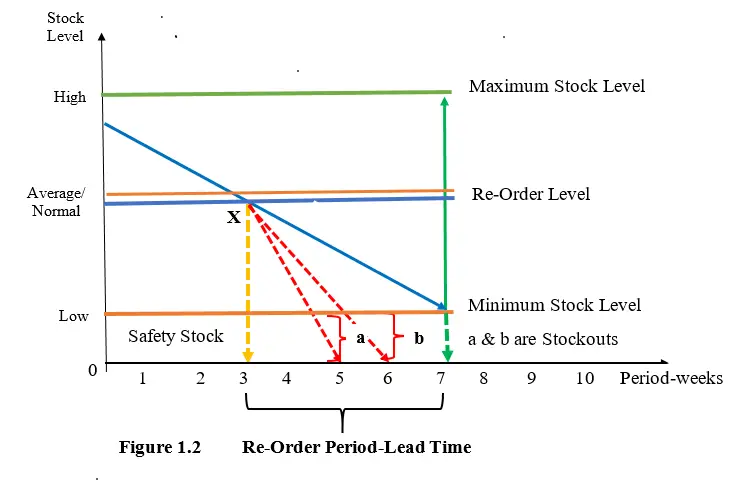
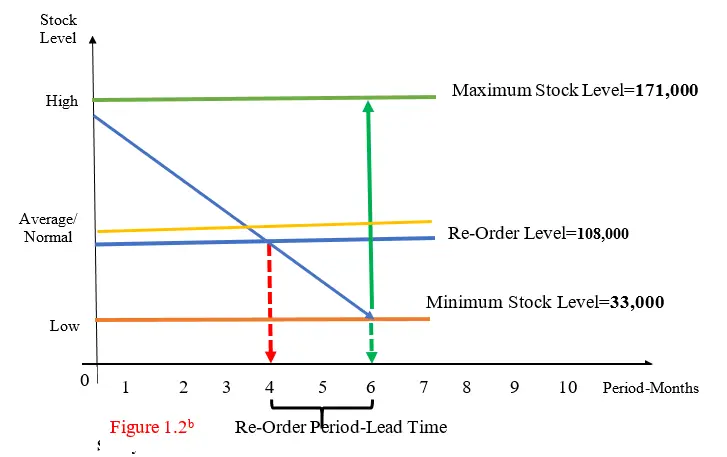
To fully understand the procedure of stock control in a normal business scenario, I will use Figure 1.2 above to explain the applicability of the formulas.
NB1: First of all, you need to understand that minimum stock level is a level which is agreed by the management as a matter of policy that stock should reach but not fall below this level. This is because considering the demand level from past experience, lesser stock level than the set minimum would put the organization in to a precarious position of shortages (stockouts) in the market. Hence loss of sales or market share. This is the first thing you need to know or understand.
NB2: Re-Order Period (Lead time)
Again, just like in the case of setting of minimum stock level, you need to understand that re-order period which is also referred to as Lead time is predetermined by the management as a matter of policy based on past experience with suppliers. Now that this period is the time difference between the time an order is placed and the time the goods are delivered (i.e., Re-Order Period), then it means that the longer the period, the higher the levels of inventory the business should maintain. On the other hand, the shorter this interval (Re-order time-Delivery time) the lower the level of inventory should be maintained by the business. This is a critical issue as far as the level of inventory is concerned.
Step 1: Now, having taken note of case one and two above, the first step in inventory control is computation of the re-order level by the purchases manager or the concerned stores official. This level is determined based on the maximum demand prevailing. Since from the records the procurement manager can tell the maximum demand level in, he organization (Maximum demand), the re-order level formula applies as follows;
Re-Order Level= Maximum Demand * Maximum Re-Order Period.
For instance, if maximum demand is 400 and maximum re-order period is 12 days, then the management or the procurement manager will do his/her timing and when the level of inventory reaches 4,800 units (Refer the formula=400*12) he or she will plan to make a new order.
Step 2: Now the purchasing manager knows at what stock level he/she should do timing to re-order. But the next question is, how much should he/she order? In other words, the Re-order Quantity. The answer is simple, there is a tool for determining that. The re-order quantity is determined by total minimum demand, maximum stock level and minimum stock level. This is guided by the formula below. It is simple, it is not rocket science.
NB: Don’t forget that total minimum demand is Minimum demand multiplied by the minimum re-order period.
So, if for example, maximum stock level is 13,000; Minimum stock level is 2,000; Minimum demand per week is 700 and Minimum Re-Order Period (5-11 Weeks), then
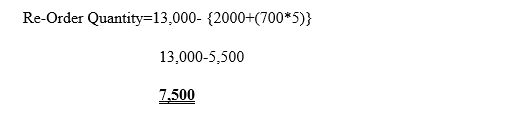
It therefore means that the purchasing manager will place an order in the 5th week whose quantity size is 7,500-units.
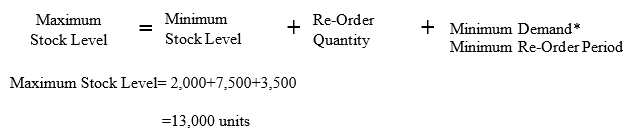
Step 3: Delivery of the 7,500 orders will be received either on the 6th or 7th or 8th or 9th or 10th or latest in the 11th week. Once this order is received, it is added to the already existing stock whose level has either reached the minimum stock level or somewhere in between minimum and maximum stock level in normal circumstances. So, the next assignment for the purchasing manager is to establish the new maximum stock level after the new order has been delivered by the supplier. For your information, it is determined by the minimum stock level, re-order quantity and the total minimum demand. This again is simple to establish. We make use of the formular as follows;
NB: I want you to get this point clearly that the above diverse levels of stock determined are as per demand level prevailing and the re-order quantity computed. Now next time the organization want to place an order, the levels will change again based on the factors we have already discussed such as demand level.
Demand for Stock
What is demand for stock? Which other terms are equivalent or the same as demand that are used in the stock model?
Definition: Demand for stock is a common term borrowed from the Economics discipline and it means the quantity consumed of a product within a particular time at a particular price.
Other names used in EOQ model are, quantity usage, consumption, sales if it is a case of finished goods. So, when we talk of demand for stock, several terms as mention can be used but they mean the same.
Rate of Demand
The rate of demand which is represented by a blue solid line which is down slopping as shown in Figure 1.2, is the rate of consumption of inventory, be it of raw material during production or finished goods in the case merchandised firms.
Assumptions of Rate of Demand
1). This rate is assumed to be a normal/average rate of consumption. That is usage of the raw materials or finished goods is as expected or as per the normal circumstance.
2). The supplier(s) will be able to deliver the placed order within the stipulated lead time or re-order period. Such that, if the lead time is between 2 to 6 days, the supplier will comply and by either 3rd or 4th or 5th or latest on the 6th day will have delivered the order or stock.
3). The safety stock remains intact and cannot be used in the normal circumstances.
4).There are no stockouts and no stockout costs.
Safety Stock
What is safety stock and why is it necessary?
Safety stock is extra inventory of goods or raw materials that is added on top of the normal stock quantities to act as shock absorbers in cases of eventualities. The aim of the management is to reduce or eliminate stockouts (deficit in raw material or finished goods). The opposite of safety stock is stockouts.
Stockouts
Stockouts is a situation when the firm experiences a shortage in supply of goods or raw materials due to increased demand (abnormal) than expected or normal or as a result of delays in delivery by the supplier(s). Or the reasons may be intentional. This shortage forces the organization to utilize the safety stock until there is zero stock balance in a worse scenario. Let us re-visit Figure 1.2 above. From point X, the demand has drastically increased (i.e., No longer normal/as expected) as represented by the red dotted line a and b indicated in the safety stock region. This implies that stock is consumed more faster such that there is a mismatch between the time the stock runs out and the time the supplier(s) delivers the additional stock or inventory.
More specifically, in Figure 1.2 there are two cases of stockouts;
Case “a” shows that there was a stockout for two weeks (i.e., 7-5). That is in the 5th week, all safety stock was fully consumed and the supplier(s) delivered new stock in the 7th week.
Case “b” shows that there was a stockout for one week (i.e., 7-6). That is in the 6th week, all safety stock was fully consumed and the supplier(s) delivered new stock in the 7th week.
Stockout Costs
When a business is out of stock, extra costs are incurred over and above the normal one. The following are some of those costs. But you can still think of others for the list is endless for it is the nature of the goods or raw materials that determine those other costs. So, we have;
- Emergency replacement ordering cost of products from other suppliers; these are alternative costs such as additional transportation costs such as overnight freight delivery cost.
- Additional administration expenses; this are costs associated with hiring extra workers to outsource for a replacement order or it can be a case where by the already existing employees are to be paid overtime salary to work for extra time to fix a stockout problem.
- Loss of market share; this occurs when loyal customers switch from the organization’s products to a substitute good due to delays in supply.
- Opportunity cost; this are other benefits forgone when a firm gets in to problems of stock outs. That is, there are those benefits that would be gotten by the firm if stockout case was absent. For example, increased sales in the future through referrals, competitive edge and good reputation leading to winning of contracts.
Let us now look at an illustration whereby we will borrow from Figure 1.2 model above using Figure 1.2b to shade more light.
Illustration
Good Atmosphere Ltd is a manufacturing company in United Kingdom and produces some motor bike spare parts which are always in high demand. One of the specific spare part the company has engaged in manufacturing is clutch with serial number-1312. The following information relates to this spare part.
Minimum demand 12,000 units per month
Maximum demand 18,000 units per month
Lead time or re-order period is 4 -6 months
Re-Order Quantity 90,000
Required
i). Compute the Re-Order Level
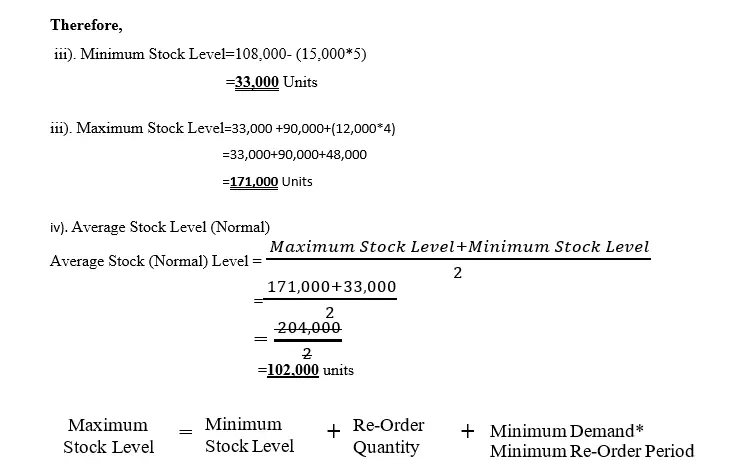
ii). Minimum Stock Level
iii). Maximum Stock Level
iv). Average Stock Level
Solution
i). Re-Order Level
Re-Order Level= Maximum Demand * Maximum Re-Order Period
=18,000*6
=108,000
ii). Minimum Stock Level
First, because normal demand and normal re-order period are unknown and are part of the model, we will first compute those values as follows;
Computation of;