Critical value (case of Z score)
1.1 Definition
Critical Value is the measurement or gauge a researcher uses to calculate the Margin of Error within a set of data. Critical values can tell you what probability any particular data point will have. It sets a threshold to make you know the limits of your data observations.
1.2 Applicability of Critical Value-Z score Approach
The Critical Value Z-score approach applies where the Sample Size is Large (i.e., n ≥30) and it advocates that a random variable will be less than or equal to a specific value. This probability must be equal to the critical probability, or the critical value. So, the value which is in percentage form represents the probability of a statistical parameter also being true for the population. Z-score critical values are classified based on the researcher’s postulation/claim.
1.3 Role of Critical Value
- It represents a range of characteristics more accurately. That is, critical value provides the limits within which we can define a certain characteristic such as a particular factor such as height of a student, sugar level in the body of a patient etc.
- Gives an insight into the characteristics of the sample size you are evaluating. That is, it describes whether the characteristic being hypothesized influence the dependent or outcome variable in a statistically significant manner or not.
- It provides guidelines on either approving or disproving hypothesis when you test it. This is because the concern of the researcher is to find out whether the changes witnessed on the dependent variable is due to chance or due to the proposed predictor, the critical value provides the thresholds to adhere to.
- Used in calculating the Margin of Error. Margin of error is calculated by considering the size of the critical value.
1.4 Step-by-Step Procedure of Computing Critical Value (CV)
The step-by-step approach entails first, the computation of both alpha value and Critical Probability as follows;
STEP 1: Computation of Alpha Value (α)
When testing Null Hypothesis using Z-score, critical value is the tool used to make a decision rule. Then, before establishing the value of Z you first compute the Alpha value (significant level)
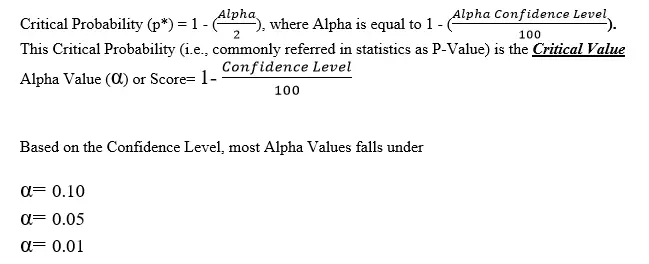
NOTE: That, Confidence Level is the probability of a statistical parameter also being true for the population you measure (expressed in a percent value). For example, if a researcher has collected data from a sample of a certain specific size (i.e. the criteria) so as to analyze some attribute of the population such as average operating costs and feels that he/she is 95% confident that the sample selected represents the true average operating cost of the population, then at 95%, he/she would compute the Alpha Value as follows;
Alpha Value (α) or Score will be equal to 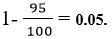
This is a case of 95% confidence level. The same method will apply if one is 90% or 99% confident of the level the sample size represents the population is concerned.
STEP 2: Computation of P Value (p)
From step one, we use the Alpha Score or value to determine the Critical Probability (i.e., P*).
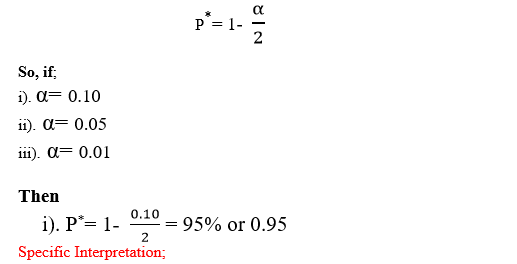
There is a 95% probability that with the sample size selected (criteria used), the sample statistic (such as mean/average of the sample selected) is the same as the population parameter (i.e., mean/average of the population) being studied. i.e. the sample statistic is true for the entire population.

Specific Interpretation;
There is a 97.5% probability that with the sample size selected (criteria used), the sample statistic (such as mean/average of the sample selected) is the same as the population parameter (i.e., mean/average of the population) being studied. i.e. the sample statistic is true for the entire population.
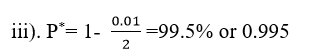
Specific Interpretation;
There is a 99.5% probability that with the sample size selected (criteria used), the sample statistic (such as mean/average of the sample selected) is the same as the population parameter (i.e., mean/average of the population) being studied. i.e., the sample statistic is true for the entire population.
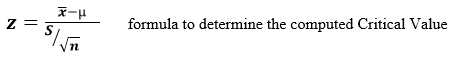
STEP 3: Computation of Critical Value
The critical value being established in this step is referred to as Computed Critical Value (don’t confuse this value with the theoretical value).
If sample size (n) is equal or more than 30 (i.e., n ≥30), then you use
NB1: That, the computed Z Score is always compared with the theoretical or Table Critical Value which is gotten from the normal Standardized distribution table.
NB2: That, the values for the connotations used in the formula are either given in a question in an examination set up or from actual data collected. The Z score is further discussed under types of critical values as indicated below
Types of critical values-under z-score approach
Based on the researcher’s postulation or theory (unproved supposition), critical value is used in carrying out three types of Null Hypothesis test, namely;
- Two “Tailed Test” Critical Value
- Right “One-Tailed” Test Critical Value
- Left “One Tailed” Test Critical Value
2.1 Two Tailed Test Critical Value-Z Score
The Critical Value of a two tailed test of a Null Hypothesis exists where by the normal distribution curve has two equal critical regions on its both the right- and left-hand side.
The corresponding Critical Value for each side is derived by halving or splitting the original level
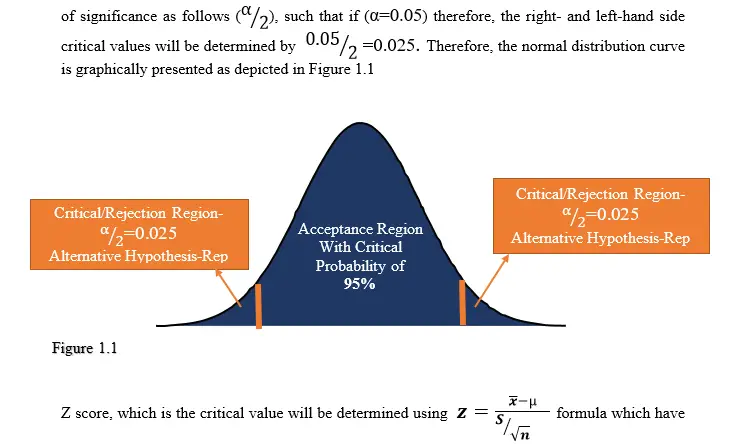
both positive and negative values (±) for this is a case of two tailed test.
NB1: That Two Tailed Test Critical Value is the value that is correspondently used when performing Two Tailed Null Hypothesis Test.
2.2 Right One-Tailed Test Critical Value-Z Score
The Critical Value of right one-tailed test of a Null Hypothesis exists where by the normal distribution curve has one critical region on the right-hand side as the name suggests.
The corresponding Critical Value for the right-hand critical region is (α). Therefore, the normal distribution curve is graphically presented as shown in Figure 1.2;
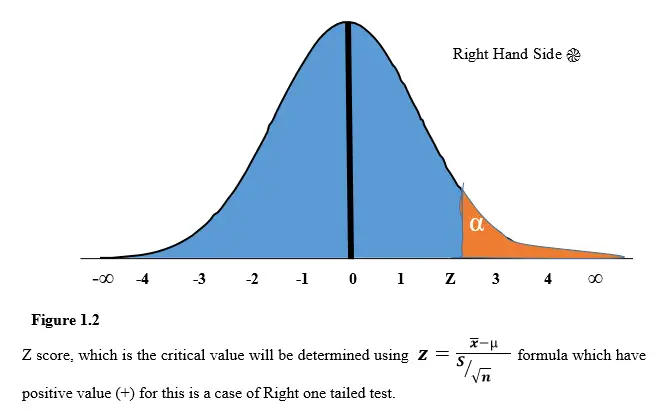
NB2: That Right Tailed Test Critical Value is the value that is correspondently used when performing Right Tailed Null Hypothesis Test.
2.3 Left One-Tailed Test Critical Value-Z Score
The Critical Value of left one-tailed test of a Null Hypothesis exists where by the normal distribution curve has one critical region on the Left-hand side as the name suggests.
The Critical Value of left one-tailed test of a Null Hypothesis exists where by the normal distribution curve has one critical region on the left-hand side as the name suggests. This case is the opposite of the right one tail test.
The corresponding Critical Value for the left-hand critical region is (α). Therefore, the normal distribution curve is graphically presented with the critical region being on the left-hand side as portrayed in Figure 1.3;
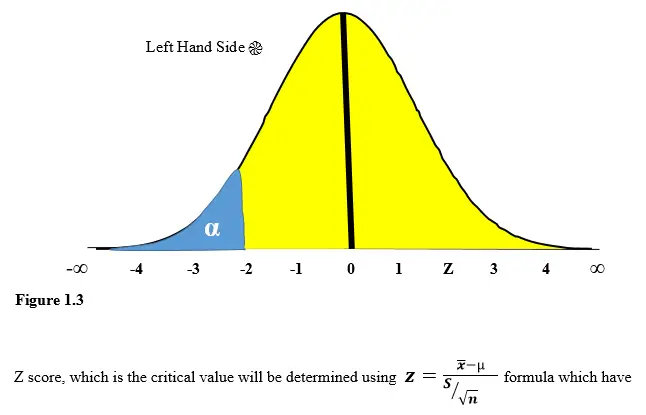
negative value (-) for this is a case of Left one tailed test.
NB3: That Right Tailed Test Critical Value is the value that is correspondently used when performing Right Tailed Null Hypothesis Test.