Methodological research gap: definition, identification and examples
What is methodological Research gap?
1.1 Definition
Methodological research gap is the missing gap of knowledge on a more appropriate underlying method(s) which can be used in research instead of the previously one. This implies that the researcher or you as a postgraduate student may propose a method in research to address a particular aspect in life or research which is more fitting to realize improved research findings than before.
Remember that in research, there are diverse methods utilized to arrive at valid research findings. That is, from the stage of formulating a research problem up to presentation of research findings, there are several methods that a researcher can adopt to come up with better and more reliable research results. Therefore, in each stage of research process, a researcher such as you and me is expected to identify methodological knowledge gap which should result to more reliable research outcome as aforementioned. This calls for two things;
One, identification of the applicable type of method at each stage in the research process and
Two, devising steps to be followed by the researcher to establish the methodological knowledge gap to be filled in the current study as compared to the one used by your predecessors as per past studies.
To achieve the two objectives above, Table 1.1 below summarizes the common stages in research and the corresponding aspects of methods utilized by the researchers and the examples of those methods and then a detailed explanation on how to identify the specific methodological knowledge gap follow suit.
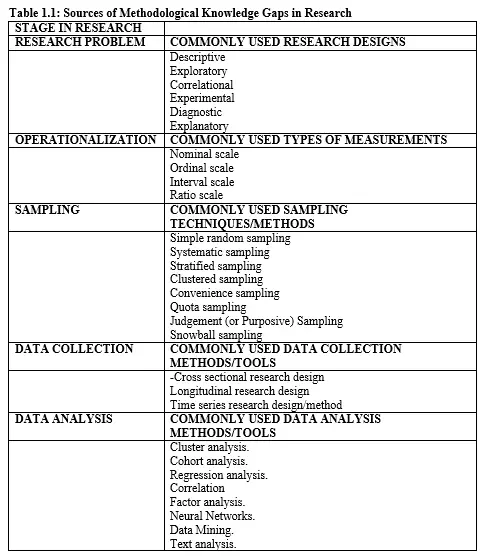
Types of methodological research gaps
From Table 1.1 above, we can identify the different types of methodological knowledge gaps that are found in research and that you as a researcher/ postgraduate student need to be familiar with and also apply.
STAGE 1: RESEARCH PROBLEM
In research process, the first step is the formulation of a research problem which is the critical matter at hand to the researcher. It is the question that the researcher need to get an answer through scientific investigation or inquiry.
NOTE-that when writing an academic research proposal or dissertation, this is the aspect we indicate mostly in chapter three under research methodology. Yes, down the line as we carry out our research assignment, there are many methods that cut across all the stages. But when we are addressing chapter three of our research proposal, the sub-title on research design refers to the method we consider when identifying the research problem. It is then at this point based on the nature of the research question to be answered that a particular method is selected to answer the question at hand. The relevant methods at this stage are;
2.1.1 Descriptive Research Design
If the researcher adopts a descriptive research design, the aim is to answer research questions of “what” nature which pertain to the respondent who is expected to provide data for the study.
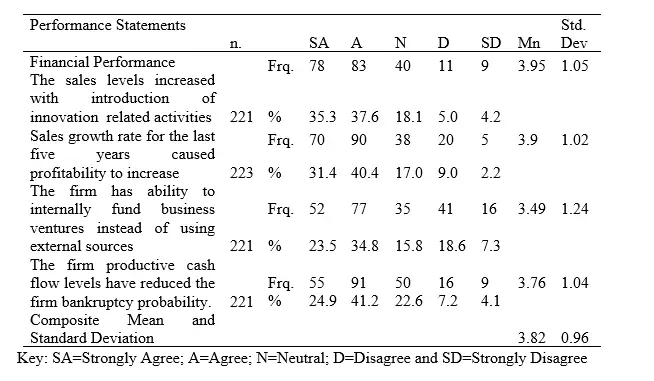
NB: To describe the characteristics of the study variables, the researcher use statistic tools such as mean, standard deviation, variance, minimum and maximum values, frequency and percentages. It is also common in research to use likert scale approach where opinion of the respondent is ranked as SA=Strongly Agree; A=Agree; N=Neutral; D=Disagree and SD=Strongly Disagree or any other connotation is also applicable.
Applicability
Used when answering research questions of ‘What’ nature of the respondents.
Used where the researcher want to describe or label characteristics of the study variable.
Used where the researcher does not manipulate the study variables-He/she just does physical observations. E.g. variables such as age, sex, education level e.t.c which are all demographic characteristics and you cannot alter or twist them.
Used where primary data is collected for the study using a questionnaire or interview schedule.
Used where the research problem is clear.
The following are extracts of past studies where the descriptive method was used to enquire on the characteristics of the study variables.
Example 1
Description of Demographic Characteristics of firms
Table 1: Ownership Structure of firms
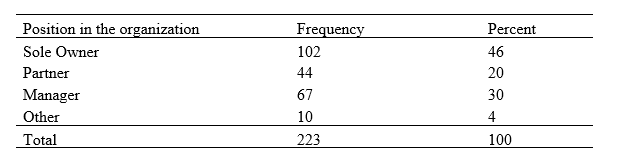
So you see, the researcher is able to describe the characteristics of the study variable, namely ownership structure of firms without any manipulations. That is, the fact remains that if it is sole ownership, it was observed to be 102 out of 223 and the percentage was 46%. Same with description of the other aspects of ownership structure.
Example 2:
Description of Characteristics of Firm Performance (The Variable)
Table 2: Financial Performance of a firms
So the question is, how do we identify the methodological knowledge gap at this stage of research question? This is explained below
Identification of Methodological Knowledge Gaps
Under descriptive research design, the researcher need to consider the following steps
Step 1: Confirm if the research question is of “WHAT” nature
The researcher need to ensure that the research question at hand is clear and that it is aimed at answering the WHAT kind of perspective
Step 2: Review of past studies
The researcher need to consider similar studies undertaken by other researchers to find out the nature or type of the study variables used in the concept under investigation. The aim being to find out how the study variables were described. For instance, did past studies use mean, standard deviation, variance, minimum and maximum values or they used range to describe the study variable.
Step 3: Assess the appropriateness of the statistics used to describe the characteristics of the study variables.
At this step, do your own critique on the statistics used to justify or disqualify why they were used to describe the characteristics of the study variables.
Step 4: Develop a Descriptive Based Methodological Knowledge Gap
At step 4, you should pinpoint or rather build up the methodological knowledge gap. This can be achieved by;
-Evaluate if the WHAT question in the past studies was effectively answered or not.
-Find out if the research design adopted is qualitative or not. In other words, is the data source primary or secondary?
-Assessing if past studies used appropriate statistics to describe the study variables in a manner that it is clear as pertain their characteristics being described.
-Find out if the descriptive research design used resulted to the appropriate sampling method or and data collection method in the past studies.
Now, based on those indicators and any other strategy which is appropriate, you as a researcher/or postgraduate student should pinpoint the gaps thereof and suggest a more appropriate method of describing the study variables to be able to answer the research question more correctly.
Illustration1
Researchers in the past literature may have used mean, standard deviation, minimum and maximum values, range and variance to describe the study variables. This can be problematic for apart from mean which is a measure of central tendency, the rest of the statistics are measures of dispersion. That is standard deviation, minimum and maximum values, range and variance are all measures of dispersion and serve the same purpose.
Therefore, in your current study, you can portray the methodological knowledge gap of descriptive nature by using standard deviation only instead of incorporating all the other measures of dispersion. You can then justify your new methodology by arguing that, one; all the other statistics serve the same purpose like standard deviation. Two, use of standard deviation help in avoiding all the other measures of dispersion which eliminates congestion in your write up. Three, the approach/methodology is economical for less time and financial resources are utilized for data to be collected will be for only standard deviation and not for all statistics as in the past studies.
2.1.2 Exploratory Research Design
If the researcher adopts exploratory research design, the aim is to answer research questions of;
Why a research study has been undertaken,
How the research problem has been defined,
What way and why the hypothesis has been formulated,
What data have been collected and
What particular method has been adopted and
Why particular technique of analyzing data has been used and a spectrum of related other enquiries are usually answered.
Applicability
Used where the research question is not clear.
Used where the area of study is a new one and the researcher is trying to answer questions such as;
What is the problem?
What is the purpose of the study?
What topics could be studied?
Used where generally there is no prior research done or the existing ones do not answer the problem in a more satisfying manner.
Used where there are no set of rules to carry out the research as such, so they are stretchy/more open ended or wide-ranging.
Used where the research is of great importance or value.
Used where there are few theories which can support its findings.
Used where qualitative data is available and can be collected using data collection tools such as interview schedules or questionnaires.
Identification of Methodological knowledge gaps
Under exploratory research design, the researcher is investigating on a new field and past studies are missing. So in this case, it is not easy to identify the methodological knowledge gap for the findings gotten are inconclusive.
However, still the researcher may have a loophole to take advantage of and identify the exploratory based methodological knowledge gap at the initial stages of research process. How can this be done? Very simple;
Illustration 2
A researcher starts with a general idea and uses this research as intermediary to identify issues that can be the focus for future research. If then the researcher(s) from the past exploratory research did not identify a solid rock that further studies in future may be anchored on, then this represents a methodological knowledge gap that can be filled. You as a researcher can pinpoint the weaknesses of the base set by your predecessor researchers and re-do a similar exploratory to provide a better research anchorage in the future.
2.1.3 Explanatory Research Design
Explanatory research design sounds like Exploratory research design as discussed in 2.1.2 above, but they are distinctly dissimilar.
An explanatory research design aims at “exploring a new” on existing phenomena, which is not well explained due to lack of previous research on it. It is a design which is helpful for furtherance of research on the same area or phenomenon for its main purpose is to discover the why and what of a subject under investigation. In short, it is a type of research design which is responsible for finding the why of the events through the establishment of cause-effect relationships.
Applicability
Used where the researcher want to further substantiate an already existing relationship by providing the cause-effect perspective.
Used where there is lack of or there is less information pertaining the relationship at hand.
Used where the researcher has to justify why relationship is of a certain nature.
Used when it is necessary to lay a foundational source of information for the phenomena under investigation.
Identification of Methodological knowledge gaps.
Under explanatory research design, the researcher need to consider the following steps
Step 1: Identify the immediate cause factors.
As a researcher be concerned with the express characteristics and existing social problems, by endeavoring to find out association between direct causes of an outcome.
Step 2: Establish research Problem.
Design an accurate research problem translating to appropriate research objective(s) so as to precisely state the principal areas of investigation to be properly linked.
Step 3: Develop a research hypothesis
In this step, establish a hypothesis with consideration of the most suspected causing study variables, which will be used in hypothesis testing to approve or disapprove the cause of the problem.
Step 4: Data collection.
In this step actual data collection process is undertaken so as to create more information to support the suggested hypothesis.
Step 5: Develop an Explanatory Based Methodological Knowledge Gap
Step 5, is the point where you should pinpoint the methodological knowledge gap. This can be achieved by;
-Evaluating past studies to identify the exiting conceptual framework established by scholars or/researchers.
-Check the level of plausibility of the variables previously used in the aforementioned conceptual framework.
-Critique positively the research findings from past studies pertaining that particular conceptual framework by highlighting the most probable factors further explaining the changes in the outcome variable. And hence suggest your own way of approach.
Illustration 3
Researchers in the past literature may have ignored critical study variables. Therefore, in your current study, you can portray the methodological knowledge gap of explanatory nature by using more critical or specific factors that can explain the changes in outcome variable (ie dependent variable) of the matter at hand. This will represent a methodological knowledge gap to your study.
Example 1
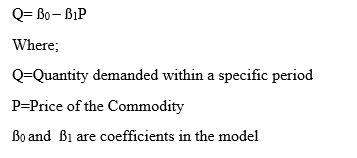
From economics point of view, the quantity demanded is determined by the changes in price levels. Hence the relationship between the price and quantity demanded of the commodity is negatively related for a normal good. Holding other factors constant. Graphically, the demand curve is up down slopping. This shows that price dictate the changes in quantity demanded.
The conceptual framework is as follows;
Example 2
In Economics, it is further proven that price of the commodity may not necessary be the direct cause of change in quantity demanded of a commodity but the Utility or level of satisfaction derived from the product by the consumer may be more predicting than just a decreasing price level. Therefore, an explanatory research design can be adopted to explain the reason as to why demand of a commodity is more tied to the utility derived by the customer and not necessarily the price per se’. This presents an explanatory methodological knowledge gap for the current study to fill.
The new conceptual framework turns to be as follows;
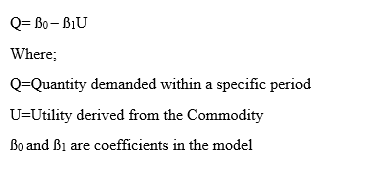
In conclusion, you can see utility is the predictor which explains more of the phenomenon of changes in demand amongst consumers than the price of the commodity.
2.1.4 Correlational Research Design
If the researcher adopts a correlational research design, the aim is to answer research questions of “How” nature which pertain to determination of how two variables relate with one another.
Applicability
Used when answering research questions of the level of strength of a relationship
Used where one wish to determine the direction of a relationship
Used where the researcher does not control the study variables
Used where the research problem is clear
Used where the relationship being tested is at a natural state
NB: A coefficient of between -1 up to +1 is used to describe the strength of the relationship.
The following are extracts of past studies where the correlation method was used to demonstrate the relationship between variables.
Example 1
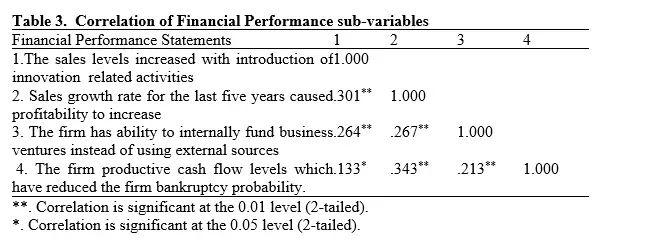
So the question that you have is, how do we identify the correlational methodological knowledge gap at this stage of research question? This is explained in below
Identification of Methodological Knowledge Gaps
Under correlational research design, the researcher need to consider the following steps.
Step 1: Confirm if the research question is of “HOW” nature
The researcher need to ensure that the research question at hand is clear and that it is aimed at answering the HOW kind of perspective.
Step 2: Review of past studies
The researcher need to consider similar studies undertaken by other researchers to find out the level of correlational strength or weakness between the study variables under investigation. For instance, if the correlation between the two variables is weak, average or strong.
Step 3: Assess the appropriateness of the concept or conceptual framework used
At this step, do your own critique on the level of correlating between study variables so as to know whether there are high chances of one variable causing the other.
Step 4: Develop a Correlational Based Methodological Knowledge Gap
In step 4, you should pinpoint the methodological knowledge gap. This can be achieved by;
-Evaluating if the HOW question in the past studies was effectively answered or not.
-Find out if the research design adopted is quantitative or not. In other words, is the data source primary or secondary?
-Assessing if past studies used right concept by selecting study variables that are fairly highly correlated (orthogonal).
-Find out if the correlation strength guarantees the researcher to further carry out regression analysis to test the hypothesis thereof.
Now, based on those indicators and any other strategy which is appropriate, you as a researcher/or postgraduate student should pinpoint the gaps thereof.
Illustration 4
Researchers in the past studies may have found no correlation (ie coefficient=0.00) between two variables. This may imply that wrong variables were chosen for the study and hence you as a researcher need to consider other more suitable variables to represent the concept of your focus. This can be achieved if the ones chosen portrays plausibility or logical relationship. This will represent a methodological knowledge gap.
Also, equally, past studies may portray a very high correlation. If that be the case, it means the variables are suffering from a multicollinearity problem and this calls for a replacement of the variables of concern. That is you as a researcher can use less number of the variables previously used by eliminating the ones which are highly correlated or replace the highly correlated variables with others with fair correlation. This again will represent a methodological knowledge gap.
Lastly and not the least, as a researcher, you can consider classification of level of strength or weakness of the correlation between two variables. From past studies, the researchers or scholars could have ignored that perspective. In your case, you can consider the proposition of Cohen of 1988 who suggested that for the purposes of interpreting the magnitude of a correlation, as well as estimating power; r = 0.10, r = 0.30, and r = 0.50 were recommended to be considered small, medium , and large in magnitude, respectively. You can rely on the same argument for sometimes past research findings have similar correlations of 0.10 up to 0.50 which is termed as weak. But you see, this could have been due to use of a small sample. This becomes a methodological knowledge gap for the end results will entail appreciation of the fact that data may be scarce in some cases and this cannot stop one from carrying out a study on a particular field.
2.1.5 Experimental Research Design
An experimental research design, is a scientific method of establishing changes in the variable being studied when another variable is manipulated. The manipulated variable is referred to as the predictor or predator or independent variable.
Applicability
Used when two or more variables are used in the study
Used where the researcher uses quantitative data
Used where the researcher is in control of one variable, namely the independent variable
Used where cause-effect relationship between or amongst several variables exist
Used where the research problem is clear
The following are extracts of past studies where the experimental method was used to enquire on the study variables.
Example 1
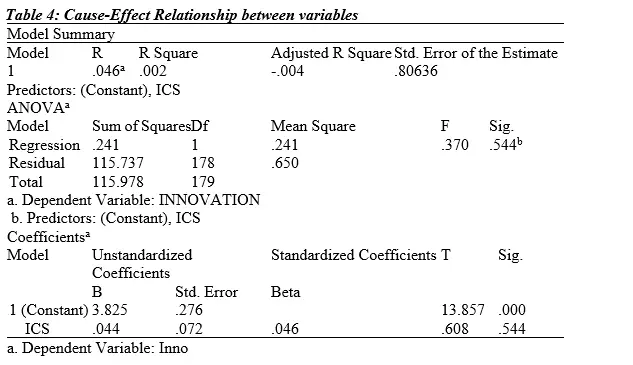
Example 2
So you see, the researcher is able to portray the cause-effect relationship between the independent variable(s) and the outcome or response variable. This is achieved by manipulating the predictor variable so as to determine the value change in the dependent variable.
So the question is, how do we identify the methodological knowledge gap at this stage of research question? This is explained below
Identification of Methodological knowledge gaps
Under experimental research design also referred to as causal-effect relationship, the researcher need to consider the following steps so as to develop the gap thereof.
Step 1: Review of past studies
The researcher need to consider similar studies undertaken by other researchers to find out the hypothesis which was tested and the research findings thereof.
Step 2: Re-hypothesize the research problem if in step 1 you realized that the cause-effect relationship was not statistically significant
In experimental research design, the aim is to test the degree of statistical significance one variable referred to as independent variable influence another variable referred to as response/outcome variable. Therefore, if the stated hypothesis was empirically disapproved due to the relationship not being statistically significant, then it means that the concept lacked plausibility or logical sense. This calls for re-defining the research problem and of course re-defining the research hypothesis.
Step 3: Develop Experimental Based Methodological Knowledge Gap
In step 3, you should pinpoint the methodological knowledge gap. This can be achieved by;
-Considering similar conceptual framework from past studies to find out the significant level of the relationship between and or amongst study variables used.
-Investigate further on the sample size used in comparison to the population size. This will guide you to conclude if the sample size was a true representation of the population or not. For if it is not a true representation, this may be the cause of research findings with no statistical significance.
-Interrogate on the perspective of plausibility of the study variables used-if they do not represent logic in their natural/physical relationship, then the regression results will not portray statistically significant relationship.
Illustration 5
Past literature may lack study variables with plausibility or logical relationship-the researcher then can further consider other variables which have a relationship in the natural phenomenon.
Past studies could have used small sample size hence adversely affecting the level of cause-effect relationship. You as a researcher need to consider a large ‘in quotes’ sample size that truly represent the entire population.
2.1.6 Diagnostic Research Design
Diagnostic research is a type of design that aims to examine the original cause of a certain circumstances or occurrence. That is the design can help you to discover more on an issue at hand. For example, the number of “return” customers as compared to new ones could have been reducing for the last three months. The question is, what other causes could be contributing to this trend or what could be the root cause of this? In other words, the diagnostic research design is helpful in identifying where the rains started beating you if it is a case of undesirable results.
It is a research design composed of three research stages, namely;
(1) Problem Inception,
(2) Problem Diagnosis, &
(3) Problem Solution.
So if the researcher adopts a diagnostic research design, the aim is to answer research questions of;
Origin of the issue – When did the matter crop up? Where do we get more evident on the matter?
Diagnosis of the problem – What is the underlying cause of the issue? In other words, what other factors could be worsening the situation?
Solution for the Matter– What is more practical/logical in solving the matter at hand?
Applicability
Used where the researcher is more concerned of the specific cause of the problem at hand.
Used where specific data need to be collected to solve an immediate need.
Used where the research problem needs more clarification.
Identification of Methodological knowledge gaps
Under diagnostic research design, the researcher need to consider the following steps
Step 1: Identify the immediate cause factors
As a researcher be concerned with the express characteristics and existing social problems, by endeavoring to find out association between direct causes of an outcome.
Step 2: Establish research Problem
Design an accurate research problem translating to appropriate research objective(s) so as to precisely state the principal areas of investigation to be properly linked.
Step 3: Develop a hypothesis
In this step 3, establish a hypothesis with consideration of the most suspected causing study variables, which will be used in hypothesis testing to approve or disapprove the cause of the problem.
Step 4: Data collection
In this step actual data collection process is undertaken so as to create more information to support the suggested hypothesis.
Step 5: Develop a Diagnostic Based Methodological Knowledge Gap
In step 5, you should pinpoint the methodological knowledge gap. This can be achieved by;
-Evaluate if past studies had identified any specific factor acting as the key cause of the matter at hand
-Check the level of plausibility of the variables previously used in similar study to the one at hand
-Critique the research findings from past studies and suggest your own way of approach
Illustration 6
Researchers in the past literature may have ignored critical study variables. Therefore, in your current study, you can portray the methodological knowledge gap of diagnostic nature by using more critical or specific factors that can explain the immediate cause of the matter at hand. This will represent a methodological knowledge gap to your study.
STAGE 2: OPERATIONALIZATION
Operationalization is the process of assigning a measurable indicator or proxy on a specific fuzzy characteristic to make it possible to measure it through observation. This approach make it possible for the researcher to systematically collect and evaluate phenomena that can't be observed directly.
Fuzzy characteristic is that kind of behavioral element portrayed by the unit of observation which is vague and not easily measurable. In other words it is not definitely expressible in fixed terms and its measurability depends on context or conditions, and therefore a precise meaning is lacking. The idea of operationalization is in addition to the well-known methodologies of measuring of study variables. That is use of measurement scales which are used to qualify or quantify data variables in statistics and they are usually four in number. That is;
Nominal Scale
Ordinal Scale
Interval Scale
Ratio Scale.
NB: That, qualitative data is measured using nominal and ordinal scale while quantitative data is measured using interval and ratio scales.
Operationalization Methodological Knowledge Gaps
How do we identify methodological gap on the basis of measurement or operationalization of a variable/construct? To achieve this objective, you, the researcher need to use the following guidelines as portrayed by these steps below
Step 1: Review Past Studies
In this step, the researcher will aim at finding out how the similar variable was measured by his/her predecessor researchers. Remember that you cannot re-invent the wheel and come up with your own way of measuring a variable. Also, for a variable to be useful in a study, it must be measurable. As we have let you know in our other articles, “if a variable is not measurable then it does not exist”.
So in this step one, you as a researcher need to find out if a universally authentic method has been used to gauge the variable.
Step 2: Assess the Appropriateness of the Method of Measurement Used
In this step, the researcher need to assess whether the proxy used to gauge the variable is correct. The extent of correctness or fitting will be assessed against some set thresholds such as:-
Contextual environment
Targeted group in the study
Generally accepted/universal method used
Technological advancements
Step 3: Positively critique to highlight areas of improvement in measurement
At this point, pinpoint the weaknesses of using the measurements used by other scholars/researchers on similar variable(s) in the past studies. This should be done with justification without necessarily critiquing in the wrong way. For example, I have witnessed postgraduate students suggesting that the past studies failed to use a certain method in measuring a particular variable.
For example, one will say that the study of X and Z failed to use ROE to measure profitability of the firm for in their case they used market share instead. So this is the reason why the current researcher want to use ROE!
This is wrong approach in creating methodological knowledge gap. The reason being that, may be as per those researchers, the research problem at hand dictated use of a certain proxy or measurement to gauge the study variables thereof. So as per their study, it was appropriate!. So the current researcher has no right to negatively critique or demonize his/her predecessor researcher’s work!
Step 4: Develop an Operational/Measurement Based Methodological Knowledge Gap
The following illustration will take care of the best way to create such gaps.
Illustration 1
Let me assume I am writing a research to investigate on the factors that influence financial performance of firms listed at the stock exchange. The factors I have proposed are X. Y and Z which are the independent variables whereas, financial performance is the criteria variable (Response variable) and is measured using Return on Capital Employed (ROCE)
The corresponding conceptual framework will be as demonstrated by Figure 1.1 below;
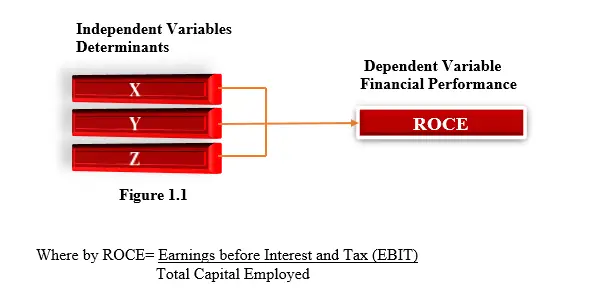
If the research findings portray that there is statistically significant influence of the three factors taken together, namely X, Y and Z on financial performance of those firms listed at the stock market, this currently represents the body of existing knowledge.
Illustration 2
From contextual point of view (users of the research report), a methodological knowledge gap based on measurement/operationalization can be established. For instance, suppose another researcher wanted to establish the influence of the same factors, namely X, Y and Z on financial performance with an aim of advising the owners of the companies as far as their Earnings per Share (EPS) is concerned. Then the method used to measure financial performance will change to EPS. This will represent a better way of informing the owners on their expectations as far as their returns are concerned. This is because it is more specific on returns originating from equity invested in the firm other than ROCE which is returns associated with all the investors, hence a general proxy. In other words, we are not saying that the previous way of measuring financial performance, i.e. ROCE was wrong for it fitted the purpose expressing performance of the firm in general.
Therefore, the more appropriate conceptual framework will be as follows as per Figure 1.2;
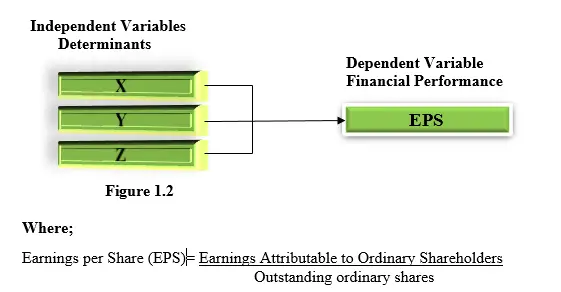
So note that although both studies are similar in every other way, the use of a different measurement of the financial performance of the firms to suit a particular purpose, represents a operational/measurement methodological knowledge gap. This is paramount for appropriateness of measurement is key in ensuring that no confusion in defining a variable and also there is clarity on decision making by the management.
Illustration 3
Suppose in another study, the researcher investigated on the factors influencing financial performance of firms listed at the security exchange and financial performance was measured in three ways, namely; Return on Equity (ROE), Return On Assets (ROA) and Return On Invest
ment(ROI) as shown in Figure 1.3 below
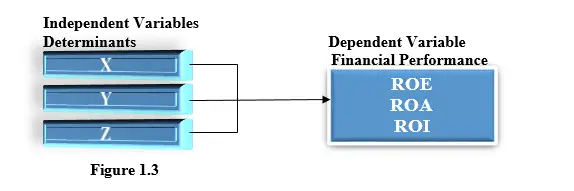
From Corporate Finance perspective, the three measures of financial performance are similar/same for ROI=ROA=ROE. This implies that the research findings will be similar and number two, the data for ROA,ROE and ROI is highly correlated and incase of carrying out multicollinearity test, the relationship will prove to be so. Therefore, there arises a need to eliminate some of dependent variables so as to;
One, avoid multicollinearity problem and
Two, avoid waste of resources for data will be required for the three measures of financial performance which represent the same outcome. This represents a methodological knowledge gap based on the measurement adopted by the researcher.
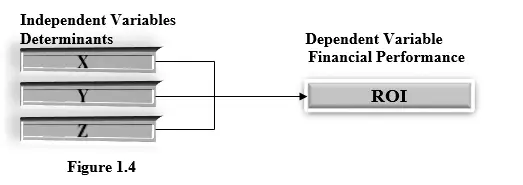
For an improved study, one can incorporate only one measurement of financial performance, such as either ROE or ROI or ROA but not all. See Figure 1.4 below
NOTE: That, in the three illustrations, we have only focused on the measurement of the dependent variable. This was only made for simplicity of understanding the concept. Otherwise, dissimilar methodologies can be used to measure all study variables as long as one can justify why he/she has gauged a variable in a particular manner. Also, for all the other measuring scale, the right applicability in measuring a characteristics should be considered. If not so, then a researcher can suggest a better method.
STAGE 3: SAMPLING
At the sampling stage in research process, there exists an opportunity to portray methodological knowledge gap also. How does this occur? As we appreciate that most of the time research data is collected from a sample and not the entire population, this increases the chances of pinpointing weaknesses on the sampling techniques used in similar studies hence suggest a better or more appropriate sampling method. The following steps is of paramount importance to you as a scholar or researcher in identifying sampling methodological knowledge gaps
Step 1: Review Past Studies
This step will help you as a researcher to compare the research method and the sampling method(s) used by researchers/scholars in past literature similar to your study. The aim is to assess the matching for each research design has a corresponding appropriate sampling technique that guide towards establishment of the right sample size .
Step 2: Identify the Sample Size used in each Past Study Reviewed
Step 2 is a furtherance of step one, which aims at checking the appropriateness of the sample used. The sample size should always be a true representation of the population. Then it means that if the past studies similar to yours has wrong sample size, it is at this juncture that you should raise a red flag for this implies that the data used in those studies could have resulted to biased research findings which have no validity.
Step 3: Critique Past studies
This is done by suggesting the most appropriate sampling methods(s) to use in your study. Either portray why the sampling method used earlier on is not suitable in the similar current study or why another method is more suitable than those used in similar studies.
Your justification points/strengths may include and not limited to;
i). Type of sampling Method used
You can argue that the sampling method used did not give all the units of observation equal chances of being selected to participate in data collection process hence may be the results were bias. For example, you see there are two types of sampling methods; probabilistic sampling which gives all units of observation equal chance to participate in data collection and this assures us of unbiased and valid research findings. Then there is non-probabilistic sampling techniques which may result to biased research findings although to some extent they can be appropriate based on the context or objective under consideration.
ii.) Mismatch between Research Method and Sampling Method
Each research method used in a study dictates the sampling technique to adopt, the type of data to collect, sample size and other many aspects. Then this calls for interrogation of the matching done by researchers in past studies to see the appropriateness of the matching, which may result to a shortcoming in the process of sampling
iii). Nature of the population
The nature of population may assume manifold aspects such as its characteristics, distribution patterns and so on and so on. This may dictate use of specifically a certain type of sampling. For instance, when data is not equally distributed such as unbalanced data panel.
Step 4: Develop a Sampling Based Methodological Knowledge Gap
Build your case of the methodological knowledge gap by highlighting issues of your concern in the past studies.
Illustration 1
In a study where the population is in form of strata, then stratified random sampling method can be adopted to establish a sample size which is a true representative of the entire population. For example, data to be collected for public hospitals in Kenya. In this case, we can consider only the level five category from the 47 counties. The counties will be representing the stratus and then further random selection can be done to pick the right sample for data collection purposes. In this case, the results are unbiased and validity is assured. Note that this is just a simple approach, for we have left out the key details. So in this case, a random sampling method is more suitable.
Illustration 2
In a study where the researcher has an aim of discriminatively looking for certain specific data to meet a specific objective, then a non-probabilistic sampling method can be more appropriate. For instance, when I was doing my PhD, my concern was data for firms listed at the Nairobi Securities Exchange. Since some of my variables would produce contradicting research findings such as cashholdings, I discriminated all financial such as banks and insurance institutions whose liquidity rule and regulations require them to keep a certain level of cash reserves which is almost composed of elements of cashholdings. Hence I went for non-financial firms for convenience purposes. Also some of the firms did not portray some of the study variables I was using in my study so I conveniently selected those firms with all the study variables I had incorporated in my study. This called for use of convenient sampling which is non-probabilistic in nature.
Look at this EXTRACT from my PhD thesis;
(“The total number of registered organizations at the Nairobi Securities Exchange by 2015 was 63 in total (NSE, 2015). Commercial banks and insurance firms were excluded in this study because they are heavily regulated than non-financial firms and have a unique capital structure (which is similar amongst themselves) from other firms (Berkman & Bradbury, 2001). NSE facilitates its member firms hence it is unique in its operations as compared to the targeted firms for the study. To ensure that the firms used in the study are uniform, such unique firm attributes were put under consideration and discriminatively selected some firms for the study. Therefore, the target population comprised of 47 firms.
Convenience sampling technique was used to collect a more representative sample for the study. Hence, the relevant observation items that enabled achievement of the research objectives were considered and therefore firms with incomplete data were left out. This implies that companies which did not have a full set of data on variables mentioned in the study were excluded. Therefore a sample size of 31 organizations registered at the NSE for the period of eleven years was selected out of the targeted population of 47 firms as shown in Table 3.1 below
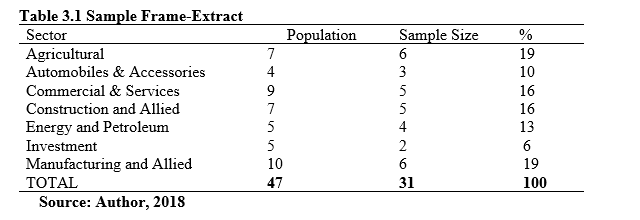
Illustration 3
Sometimes, past studies may use sample size which is large but not scientifically determined. That is, as one arrives at a particular sample size, a scientific method should have been used so as to justify the authenticity of the sample size and its usability in the study. Therefore, in the current study, the researcher need to justify why such a “sample size determination formula” has been used.
For example, the following extract is from a past study where Yamane (Formula) was used to determine the sample size
Sample Size
The appropriate sample for this study was 265 SMEs drawn from a target population of 5311 SMEs operating in Machakos County using Yamane formula (1967). This formula was used to determine the sample size (n) which is the number of subjects to be randomly selected from each category of SME projects in Machakos County.
Sampling Procedure
The procedure of how the 265 firms was selected out of the total population of 5311 was summarized in Table 3.2
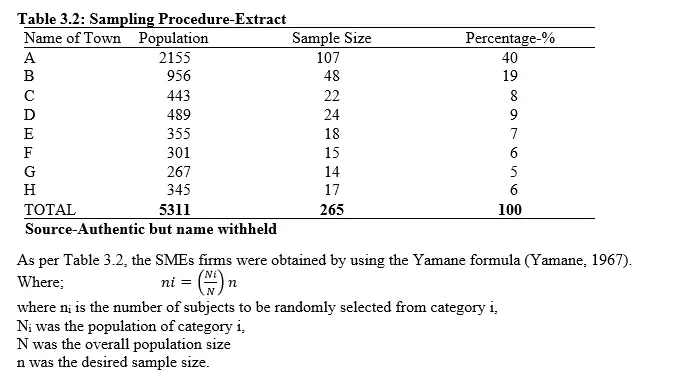
NB: The researcher has to justify why such a formula is used in such a study. Of course there are other sample size determination formulas and if used by the researcher, then again justification is necessary. All these sampling concerns portray sampling methodological knowledge gaps.
STAGE 4: DATA COLLECTION
After sample size or population has been determined in stage 3, then actual data is collected. This process also just like the other stages of research process presents to you as a researcher another chance to demonstrate the data collection methodological gaps in existence as per past studies.
Remember that data collection is a sensitive procedure and if the appropriate data collection method is not used, then biasness dominates the data collected and the data analysis process will bring forth results which are not admirable. Data collection utilizes three data collection research designs as explained in our research Hub, namely;
Cross sectional Research design- A cross-sectional study design is a type of research design in which data is collected from many unit of observations/respondents at a single point in time.
Longitudinal Research design- A longitudinal study design, is a type of research design whereby researchers repeatedly examine the same unit of observations/respondents to detect any changes that might occur over time (ie at different points in time) without trying to influence those variables.
Time series Research design- Time series designs are a sub-set of longitudinal research design which its analysis focus is on “large series of observations made on the same variable consecutively over different point in time.
The following steps will guide you to establish the data collection methodological knowledge gap
Step 1: Review Past Studies
From past studies, identify the data collection research design used to assess its appropriateness in that study(ies). Based on the research problem at hand, one is able to tell the most suitable data collection research design.
Step 2: Assess the nature of population or sample to collect data from
This aspect represents the source of data which can either be primary data or secondary data
If primary data for several variables-then cross sectional research design is useful
If secondary data for several variables-then longitudinal research design is helpful
If secondary data for only one variable-then time series research design is helpful
Step 3: Critique Past studies
From past studies, demonstrate that the methods of data collection are unsuitable to your current study. This can be achieved by positively proving that the data collection research design is only suitable in the past similar studies but not the current one. This can be achieved by suggesting the appropriate method of collecting data based on the aforementioned data collection research design which is well fitting.
Step 4: Development of Data Collection Based Methodological Knowledge Gap
At this point show the suitability of the current methods of data collection by justifying that the methods will meet objectives such as;
Right data collection method ensures data validity which translate in to unbiased research findings.
Right data collection method saves time.
Right data collection method translates to reliable data analysis methods etc etc.
Illustration 1
Suppose you are carrying a study on the relationship between time taken to coach undergraduate students and academic performance for the last 5 years from 2016 up to 2020.
Facts;
The data to be collected is primary data and will be collected through questionnaires issued at the year 2020
This is data collection at one data point to represent performance information of students for 5 years
Data is collected from more than one unit of observation
Therefore, cross sectional data collection method will apply.
Illustration 2
Suppose you are carrying another study on the relationship between time taken to coach a particular undergraduate student by the name James and his Mathematics performance for the last 5 years from 2016 up to 2020.
Facts;
One; the data to be collected is secondary data and will be collected through using secondary source such as James academic reports from the year 2016 up to 2020.
This is data collection at 5 different data points, that is 2016; 2017;2018;2019 and 2020.
Two; data is collected for one unit of observation, ie James who is a student.
Therefore, longitudinal data collection method will apply. This will be a new approach of collecting data hence a dissimilar data collection methodological knowledge gap is realized.
STAGE 5: DATA ANALYSIS
This is the last stage in research process whose end result is the research findings which in turn are used for making conclusions. In this stage there are diverse data analysis approaches that are useful to the researcher based on the objectives to be achieved.
Since the methods are several, (visit STATA, E-VIEWs, SPSS program) I will demonstrate the steps to follow when creating data analysis methodological knowledge.
The following steps matter
Step 1: Review Past Studies
Revisit past studies similar to your topic to evaluate the data analysis method utilized and the justifications the authors have provided.
Step 2: Identify both the research question and the specific objectives of the study.
From the past studies you review, you will notice that at least one or two methods of data analysis has been utilized. At this point, equally identify the corresponding research questions and the research specific objectives which obviously should emanate from the research question.
Step 3: Identify the research design used by the researcher in that past study.
With the research question and the specific objectives at hand, further identify the research design used and evaluate its suitability in answering the research question at hand and achieving the study specific objectives. Ask yourself, whether with such a research design, the two aspects were fulfilled to satisfaction.
NB: For your information, the right matching should be for instance, if the research problem was descriptive in nature, the research question will be descriptive and specific objective as well. Then, descriptive research methodology will be used, followed by descriptive research methods and descriptive data analysis. Similarly, the same applies in all other research designs.
Step 4: Benchmark the data analysis method used and the researcher’s research question
Again consider the matching of the research design chosen with the data analysis method used if it is correlated in any way. Of course, you know that the research design chosen dictates the data analysis method used. And the data analysis used is meant to answer the research question. If this is the case as per the past study research findings, then it’s ok. But if not, this becomes a case to raise some questions on how best the data analysis should have been done.
Step 5: Benchmark the data analysis method used and the researcher’s specific objectives
Repeat step 4 to step 5 and consider the matching of the data analysis method and the extent to which the tool has helped in achieving the set specific objectives of the past study. Of course, you know that the data analysis method chosen dictates the extent to which the specific objectives are achieved. If with the data analysis used, the specific objectives are fully achieved, ok. But if not, this becomes a case to raise some questions on how best such objectives should have been achieved. This calls for identification of areas for further research as indicated in most of the academic papers in chapter five or six of the project paper.
Step 6: Critique the data analysis approach used in the past studies
In step 6, you highlight the appropriate data methodology to use in your current study by pinpointing either weaknesses or strengths of the methods used earlier on by your predecessors in the similar studies you have reviewed.
Show how more suitable or appropriate your methodology is and how it will sufficiently be able to answer the question at hand and meet the specific objectives of the study.
NB: As you review past studies to interrogate the data analysis method used, you need to be careful of the specific objectives which that particular researcher wanted to achieve.
Step 7: Development of Data Analysis Based Methodological Knowledge Gap
Pegged on the hypotheses set, demonstrate how the data analysis has proven or disapproved the hypotheses.
Assess the level of hypothesis test statistical significance to determine whether to fail to accept the null hypothesis (ie reject the null hypothesis) or fail to reject the null hypothesis (ie accept the null hypothesis).
State the data analysis methodological knowledge gap thereof. So in the following illustrations, we will consider different scenarios with different researchers as portrayed below;
Illustration 1
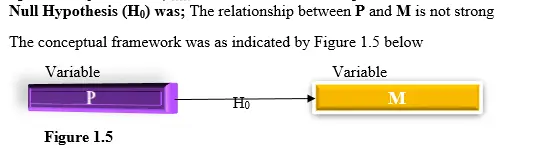
Assume that researcher one carried out a study on the relationship between P and M.
So in this case, the research question he wanted to answer was;
Research Question: Does variable P have a strong association with M?
The corresponding;
Specific Objective was; To determine the relationship between P and M
NOTE the following;
The specific objective to be achieved is to establish the relationship between P and M variables.
In the conceptual framework, we do not indicate the role of the variables for we are concerned about the relationship and not which variable influence the other. So no predictor or response variable classification.
The researcher incorporated correlation data analysis method to find out the association between P and M variables. Pearson Product Moment correlation model was used.
Research findings revealed that there exists a strong positive relationship between P and M.
Now, let us assume that illustration one will represent the “existing body of knowledge” that there exists a strong positive correlation between P and M. This assumption will help us understand how to develop data analysis methodology knowledge gaps that can arise from this first case.
So let’s move on….
Illustration 2
From past literature, researcher two came across a study by researcher one (refer to researcher one research findings) whereby the research findings showed that there exists a strong positive relationship between P and M.
However, according to researcher two, there exists some data analysis methodological knowledge gap as per the past study undertaken by researcher one if regression analysis is incorporated.
Why?
One; researcher one focused on correlation of P and M variables while the current study of researcher two is on the influence of P on M hence need to carry out regression analysis and not correlation analysis
Two; the previous study of researcher one was on determining the level of strength of the relationship between P and M while in the case of researcher two, the focus was to establish the level of significance influence of P on M.
Three; both the research questions and specific objectives of the two researchers were dissimilar.
Point of correction-when creating the methodological gap of whichever nature, its common amongst researchers even I have witnessed my postgraduate students, even others during postgraduate academic defenses state that “researchers as per past literature failed to use either multiple regression or correlation analysis method and that is why there is a methodological gap.”
No, you cannot afford to say that because past literature had different research question, different specific objective and of course different hypothesis and so the method used was appropriate as far as that case was concerned. So, no one has a right to negatively critique that researcher(s)!
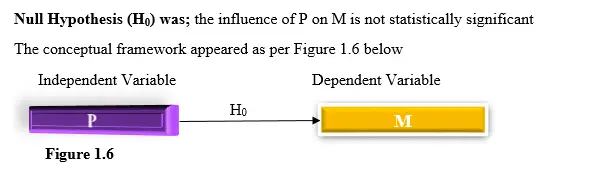
Therefore, Researcher two further carried out a research on the influence of P on M. This means that, he sought to investigate the level of significance that P has on M.
Now, in this case the research question was,
Research Question: Does variable P have statistically significant influence on M?
The corresponding;
Specific Objective was; to establish the influence of P on M
NOTE the following;
1. The specific objective to be achieved is to establish the influence of variable P on variable M.
2. In the conceptual framework, we indicate the role of the variables for we are concerned about the influence that one variable (independent variable) has on another variable (dependent variable). So P is taken to be the predictor variable and M is the response variable as indicated in the conceptual framework unlike in the correlation case were there was no classification of the same two variables.
Therefore, from illustration two, there exists some data analysis methodological knowledge gap for researcher one used correlation data analysis method which was and is for sure appropriate for determining the strength of a relationship. But it cannot apply for testing the level of significance of influence of one factor on another. Hence researcher two has to point out that instead of using correlation, simple regression method is more applicable. This way, the knowledge gap is filled and this justifies why researcher two is undertaking a similar study to that of researcher one for there is new knowledge added to the already existing body of knowledge.
Research findings-it was established that there was statistically significant influence of P on M. Therefore, the researcher failed to accept the null hypothesis. Ie rejected the Null Hypothesis so as the accept the Alternative Hypothesis (HA) That variable P has statistically significant influence on P.
Let us assume that both illustration one and two now represent the “existing body of knowledge” that there exists a strong positive correlation between P and M and also P has statistical significant influence on M. This assumption further will help us understand how to develop data analysis methodology knowledge gaps that can arise from these two cases.
So let’s move on again..
Illustration 3
From past literature, researcher three came across studies by researcher one and researcher two whereby although both studies focused on P and M variables, there still existed some data analysis methodological knowledge gap as per those past studies.
Why?
One; although both researcher one and two focused on the P and M linkage, one was looking at the correlation of P and M while researcher two considered the influence of P on M and as a result, one used correlation analysis and the other simple regression analysis.
Two; although researcher two work was an improved study of researcher one, he only focused on a Bivariate model where by only one independent variable was considered in predicting the changes in

Three; use of one predictor variable may not be good enough to estimate the changes observed in the response (dependent variable). This is because in normal circumstances, changes that occur on the dependent variable (outcome variable) may not originate from only one predictor/factor. So the simple regression model cannot be the most appropriate estimator of the dependent variable.
Therefore, there exists some data analysis methodological knowledge gap for researcher one used correlation data analysis method which was and is for sure appropriate for determining the strength of a relationship. But it cannot apply for testing the level of significance of influence of one factor on another.
Similarly, the research findings of researcher two of P having statistically significant influence on M was ok. However, use of Bivariate model is not good enough to conclude that P is only influenced by P alone. Hence researcher three has to point out that instead of using simple regression method, multiple regression analysis is far much better for more than one predictor/independent variable is used to predict the outcome variable. This way the knowledge gap is filled and this justifies why researcher three is undertaking a similar study to researcher one and two for there is new knowledge added to the already existing body of knowledge.
NB: That, in Multiple regression data analysis method, Ordinary Least Square (OLS) tool or model is used to analyze the end results.
Therefore, Researcher three carried out a study to determine the factors that influence M. She sought to determine the influence of two variables, namely P and Q which were classified as the independent variables on M.
Research Question:
Does variable P and Q have statistically significant influence on M?
The corresponding;
Specific Objective was;
To establish the influence of P and Q on M
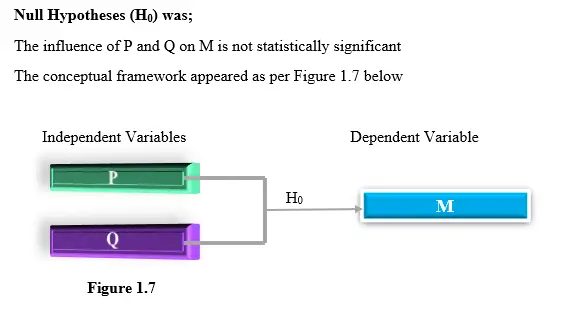
NOTE the following;
1. The specific objective to be achieved is to establish the influence of two variables, P and Q on variable M.
2. In the conceptual framework, we indicate the role of ALL the variables for we are concerned about the influence that two variables (independent variables) have on another variable (dependent variable). So both P and Q are taken to be the predictor variables and M is the response variable as indicated in the conceptual framework.
3. Although the two independent variables appear separately in the conceptual framework, this does not represent a corresponding two research questions, two research objectives and two hypotheses as witnessed in most academic research proposals/projects. CONCEPTUALLY or THEORETICALLY, the conceptual framework represent only one theory of the joint influence of P and Q on M.
Research findings-it was established that there was statistically significant influence of P and Q on M. Therefore, the researcher failed to accept both null hypotheses. I.e. rejected the Null Hypotheses so as to accept the Alternative Hypothesis (HA) that variable P and Q has statistically significant influence on M.
Similarly, let us assume that the THREE illustrations represent a wider existing body of knowledge so far. This assumption further will help us understand how to develop data analysis methodology knowledge gaps that can arise from these three cases.
So let’s move on further..
Illustration 4
Again, from past literature, researcher four came across studies by researcher one, two and three which formed the existing body of knowledge. But still researcher four is able to incorporate new data analysis methodological knowledge gap as per the past studies undertaken by the three researchers so far.
Why?
One; some studies considered correlation, others simple regression and others multiple regression analysis methods as witnessed in the case of researcher one to three
Two; some studies used bivariate models with one predictor variable while others like researcher three used multivariate model with two predictor variables
Three; although use of multivariate model with two predictor variables is better and more appropriate in estimating changes in the dependent variable, there still exists some data analysis methodological knowledge gap for researcher three performed multiple regression whereby she ran all the two predictor variables at once either using SPSS or STATA computer program. This approach/method did not give her room to evaluate the prediction power of every incremental predictor variable considered.
Therefore, researcher four carried out a similar study like the rest but incorporate Hierarchical multiple regression model instead of just using multiple regression. This methodology has an option of portraying which predictor variable has more power to estimate the response variable for there is an option in the computer program to command significant change. In addition, use of four predictor variable is more accurate in estimating the dependent variable changes.
NB: That, in Hierarchical Multiple regression data analysis method, Ordinary Least Square (OLS) tool or model is used to analyze the end results.
Researcher four therefore aimed at interrogating on the factors influencing variable M as it was in the cases of researcher one, two and three. But researcher four feels that there are more factors than just two that influence variable M. For this matter, he proposed four variables, namely; P, Q, R and S as the predictor variables.
Research Question:
Does variable P, Q, R and S have statistically significant influence on M?
The corresponding;
Specific Objective was;
To establish the influence of P, Q, R and S on M

The influence of P, Q, R and S on M is not statistically significant
The conceptual framework appeared as per Figure 1.8 below
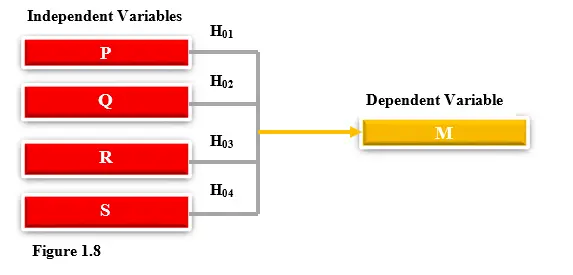
NOTE the following;
1. The specific objective to be achieved is to establish the influence of four variables, P, Q, R and S on variable M.
2. In the conceptual framework, we indicate the role of ALL the variables for we are concerned about the influence that the four variables (independent variables) have on another variable (dependent variable). So all variables P, Q, R and S are proposed to be the predictor variables on M which is the response variable as indicated in the conceptual framework.
3. Although the four independent variables appear separately in the conceptual framework, this does not represent corresponding four research questions, four research objectives and four hypotheses as witnessed in most academic research proposals/projects. CONCEPTUALLY or THEORETICALLY, the conceptual framework represent only one theory of the joint influence of P, Q, R and S on M.
Research findings-it was established that there was statistically significant influence of P, Q, R and S taken together on M. Therefore, the researcher failed to accept the null hypothesis i.e. rejected the Null Hypothesis so as to accept the Alternative Hypothesis (HA) that variable P, Q, R and S has statistically significant influence on M.
CONCLUSION
In conclusion, under methodological knowledge gap perspective, there are many ways of the researcher like you and me to argue any case at hand and succeed. This will further be discussed in oncoming online tutorials.