Opportunity Cost
Opportunity cost is the benefit of the next best alternative forgone. Therefore, the term “opportunity cost” is not a cost element per se’ but it is the lost benefit as a result of picking another alternative. This scenario is common where the resources are scarce and production of a product need to be allocated on the basis of the benefits derived from that product. So, if the producer chooses one product, he or she has to forgo production of another product which a competitor. You should note that opportunity cost applies on both physical goods and services provided (i.e., the term product used means either physical or services). So, opportunity cost of the product being produced is the forgone benefits which are associated to the other competing product which was declined. This type of cost is on the basis of critical decision criterion. A production possibility frontier curve as used in economics will aid in making you understand this concept as follows;
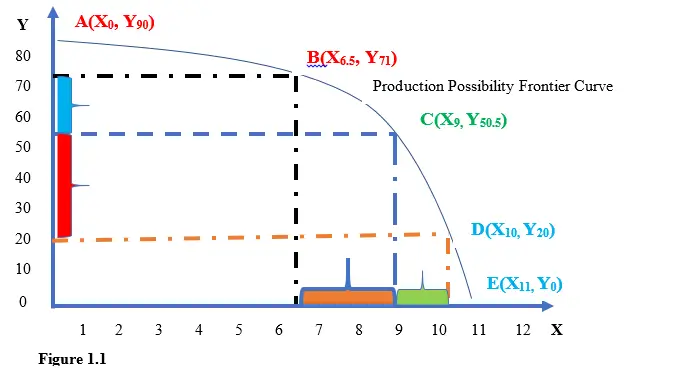
Illustration of Opportunity Cost
Cost elements under this criterion is pegged on the critical decision management has to make. It is at a point when the management is at the cross-road and the decision made will result to key turn of events. The following SIX cases will guide you on opportunity cost concept.
NB: For case 1 to 5, they cover the case of production of physical goods as indicated in Figure 1.1 above. In this case, at the extreme levels of production “A” and “E” are the only cases portraying opportunity cost on physical goods. Whereas, the production levels B to D, does not represent opportunity cost. Further, case 6 is a bank service product provision which portray opportunity cost.
Assumptions
For good X
- Selling price of X is $65 per unit.
- Cost of production Y is $25 per unit.
- Profit (benefit) 65-25=$40
- That all what is produced is sold.
- The production frontier curve represents the total economic resources available for producing product X and Y.
For good Y
- Selling price of Y is $25 per unit.
- Cost of production Y is $8 per unit.
- Profit (benefit) 25-8=$17
- That all what is produced is sold.
- The production frontier curve represents the total economic resources available for producing product X and Y.
There we go…..
Opportunity Cost For A Case Of Physical Goods
CASE ONE (At production level-A)
As per Figure 1.1, the producer has produced 90 units of product Y and zero (0) units of product X i.e., (X0, Y90)
In this case, ALL the economic resources have been used to produce 90 units of product Y which have also been sold. Hence, the total profit is 17*90= $1,530. This is the actual monetary benefits gotten.
But this benefit will be at the expense of the forgone benefits of using all the resources to produce 11 units of good X (i.e., X11, Y0) which translates to 40*11=$440.

CASE TWO (At production level-E)
As per Figure 1.1, the producer has produced 11 units of product X and zero (0) units of product Y i.e., (X11, Y0)
In this case, ALL the economic resources have been used to produce 11 units of product X which have also been sold. Hence, the total profit is 40*11=$440. This is the actual monetary benefits gotten. But this benefit will be at the expense of the forgone benefits of using all the resources to produce 90 units of good Y (i.e., X0, Y90) which translates to 17*90= $1,530.

Rational Decision
It is better or it is more economical to utilize all the resources to produce 90 units of product Y than to produce 11 units of product X and zero units of product Y.
CASE THREE (At production level-B)
As per Figure 1.1, the producer has produced 6.5 units of product X and 71 units of product Y i.e., (X6.5, Y71).
Now, in this case, SOME of the economic resources have been used to produce 71 units of product Y while the remaining ones were used to manufacture 6.5 units of good X. Hence, the total profit for Y is 17*71= $1,207. While the profits for product X was 40*6.5=$260. Therefore, the total actual monetary benefits gotten for the two products is $1,467 (i.e., 260+$1,207).
NB1: There is no opportunity cost in this case.
Why?
Because all the resources have been rationalized between the two products, that is between X and Y.
CASE FOUR (At production level-C)
As per Figure 1.1, the producer has produced 9 units of product X and 50.5 units of product Y i.e., (X9, Y50.5).
Again, in this case, SOME of the economic resources have been used to produce while the remaining ones were used to manufacture 9 units of good X and 50.5 units of product Y. Hence, the total profit for X was 40*9=$360. While the profits for product Y is 17*50.5= $858.5. Therefore, the total actual monetary benefits realized for the two products is $1,218 (i.e., 360+$858.5).
NB2: There is no opportunity cost in this case.
Why?
Because all the resources have been rationalized between the two products.
CASE FIVE (At production level-D)
As per Figure 1.1, the producer has produced 71 units of product Y and 6.5 units of product X i.e., (X10, Y20).
Again, in this case, SOME of the economic resources have been used to produce 20 units of product Y while the remaining ones were used to manufacture 10 units of good X. Hence, the total profit for X was 40*10=$400. While the profits for product Y was 17*20= $340. Therefore, the total actual monetary benefits gotten for the two products is $740 (i.e., 400+$340).
NB3: There is no opportunity cost in this case. Why? Because all the resources has been rationalized between the two products.
CASE SIX: Commercial Bank Loan
Commercial banks main source of income is interest charged on loans advanced to customers. The banks have to make a decision to either
- Lend loans at 16% of the principal amount
OR
- Keep the cash in safe custody in their premises (i.e. this is idle money with 0% interest)
FURTHER ANALYSIS OF THE TWO BANK OPTIONS
If the bank opts not to lend the cash, the money will remain in the cash box with zero (0%) interest. In other words, the choice made will make the bank forgo the 16% interest on principal amount.
So, the opportunity cost of not lending money to the customers will be the forgone benefit of 16%. This is a very costly decision to make.
If the bank opts to lend the cash, the money will attract an interest of 16% of the principal amount. In other words, the choice made will make the bank forgo 0 % interest on principal amount.
So, the opportunity cost of lending money to the customers will be the forgone benefit of 0%. This is a very cheap decision to make.
Conclusion Bank Manager Action
So, why do banks go looking for customers to issue loans to?
Is it because they will reap a 16% interest as per our example?
The answer is NO.
The reason is because they fear remaining with their cash in the cash box for in such a case, they will forgo a 16% interest they could have gotten if they gave out loans.
In conclusion, the reason why bank managers spend sleepless nights thinking of who next to issue with loans is because the OPPORTUNITY COST of lending loans is very low (0%-zero).
How Does Opportunity Cost Work?
Opportunity Cost works in an off-setting manner where by one has to forgo one option to get the other.
So, opportunity cost involves cases where the decision maker picks completely one option and completely leaving the other one. That is, one picks case A and not B but not both. That’s why in our previous cases level A and level E of production in Figure 1-1 and the case of loan issuance in banks are the only cases representing opportunity costs. Other cases are not for the scare economic resources have been rationalized between the two products.
Advantages Of Opportunity Cost
- Help in allocation of resources
Opportunity cost concept help in assigning the scare resources or wealth to the right function for it is possible for the decision maker to assess the benefits to be lost as a result of picking one alternative instead of another.
- Assessment of risk level of a business
It is possible to assess risk level of a certain variable and create ways and means of mitigating the adverse event. For example, in the case of sale level, it is possible to select out of different products which one to prioritize first so as to ensure that lost opportunities represent minimum losses.
- Guide in capital project selection decision
For the case of capital projects, selection of the best project to invest in is based on opportunity cost forgone for the case where the least benefit is forgone results to the best project selected.
- Guide in setting of price for goods and services.
The opportunity cost is the yardstick to setting of selling price of goods and services. This is because the set price determines the product to be forgone and the product to be adopted.
Disadvantages Of Opportunity Cost
- Not universally understood hence not common amongst interested parties
The aspect of opportunity cost is not commonly well-known by many people and so it is not useful or applicable by most of the businesses especially the small ones.
- Disparities in calculating its appropriate value
It is complicated to calculate the value of opportunity cost for its definition is controversial amongst scholars. So, the confusion makes different users calculate it differently.
- Not accounted for in the books of accounts of firms
Opportunity cost is not termed as an economic cost as it is in the case of other costs such as transport cost, insurance expenses which involves actual cash out flow. So, this element is not factored in the profit and loss account of the business.
 About the Author - Dr Geoffrey Mbuva(PhD-Finance) is a lecturer of Finance and Accountancy at Kenyatta University, Kenya. He is an enthusiast of teaching and making accounting & research tutorials for his readers.