Null hypothesis-definition and null hypothesis testing
1.1 Introduction
Once formulation of effective hypothesis is developed as discussed in our “formulation of effective hypothesis” article in Accountingnest.com website, the next step is hypothesis testing. So the researcher need to scientifically or empirically test the hypothesis stated for formal approval or disapproval. Remember in hypothesis formulation we said it is the process of evaluating the merit of the hypothesis using a verifiability or falsifiability-oriented experiment or method to either prove or disapprove the hypothesis. The end result then is that, either the hypothesis is true hence accepted or it’s false hence rejected.
So in step two is what the researcher was waiting for to formally examine two opposing hypotheses, namely?
The Null Hypothesis denoted as; H0
The Alternative or research hypothesis, denoted as H1
The two stated hypotheses are supposed to be mutually exclusive and exhaustive.
Mutually Exclusive means occurrence of one event associated with one hypothesis prevents the occurrence of the other event under consideration of the other hypothesis. In other words, mutually exclusive means that if one is true the other must be false. Otherwise the two events cannot assume the same status quo at the same time. For instance, after testing the hypothesis, we either find that the Null hypothesis is true while Alternative hypothesis will be false or vice versa.
On the other hand “Exhaustive” means that there is limited decision rules such as acceptance or rejection and no other ruling. In other words, there are only two decision rules. That is we see that they must include all possible occurrences.
Null Hypothesis and Alternate Hypothesis
Null and Alternative Hypotheses are the two most relied upon tools by the researchers to test a claim.
2.1 Null Hypothesis(H0)
It is the specific statement expressed about the population parameter made for the purposes of initiating an argument. It states the assumptions to be tested, is a status quo. It is always about the population parameter and not the sample statistic.
Null Hypothesis is referred to as the traditional or the orthodox way used when predicting a relationship expected outcome.
NB1: That, the predictions by the Null Hypothesis may assume diverse statements as follows;
It may state that there is no relationship between two groups that the researcher compares on a certain population variable. For example, it may state that there is no relationship between strategic location of a business and its performance.
It may state that there is no significant difference when different groups are compared with respect to a particular variable. For example, in case two, it may state the case one Null hypothesis as “there is no significant difference between strategic location of a business and its performance”.
You should note that the two expressions are the same and they imply that there is no true difference in the sample statistic and population parameter under consideration (hence the word ‘null’ which means invalid, void, or amounting to nothing) and that the difference found is accidental arising out of fluctuations of sampling (ie occurred solely by chance). It is denoted as H0
2.2 Alternative Hypothesis (H1)
Alternate/or Research Hypothesis: It represents all other possible population parameter values except the one that is stated in the Null Hypothesis. It aims at challenging the existing status quo as expressed by the Null Hypothesis. This is actually the Hypothesis that is being supported by the researcher hence referred to as the Research Hypothesis. In fact, most researchers and analysts look forward to REJECT the null hypothesis because by doing so is a strong conclusion that the expected outcome is not by chance alone. This requires strong evidence in the form of an observed difference that is too large to be explained solely by chance.
Alternate Hypothesis proposes a relationship between two or more variables, and it is denoted as H1.
NB2: That, the predictions by the Alternate Hypothesis may assume diverse statements as follows;
For example, if the researcher feels that strategic location significantly determines business performance, he or she will state the Alternate Hypothesis as either;
There is statistically significant relationship between strategic location of a business and its performance.
OR
There is statistically significant difference between strategic location of a business and its performance”.
OR
Strategic location of a business significantly determines its performance
You should note that the three expressions are the same and they imply that there is a true difference in the sample statistic and population parameter under consideration. That is the difference found is not accidentally arising out of fluctuations of sampling (i.e. it is as a result of significant factor(s) which is too large to be explained solely by chance). It is denoted as H1
2.3 Statistical Hypothesis
Statistical hypothesis is an assumption about statistical populations that one seeks to support or refute. The Null Hypothesis and Alternative Hypothesis together are called Statistical Hypothesis.
Null hypothesis testing basic concepts you need to know
Before looking in to details of Null Hypothesis, we need to know some terms used under both null and alternate hypothesis. These are the two commonly used hypotheses in research when hypothesizing or postulating about a certain population characteristic that has been observed in the sample.
3.1. Population
Definition
Population is a group of identical items or individuals, whether natural or artificial that has a common characteristic (known as population characteristic) that the researcher wants to study. The characteristic must be identified or classified as per researcher’s criterion he or she has chosen and must be uniform across all the members of that population. Population is also referred to as the Universe.
3.1.1 Population Characteristic
Definition
Population characteristic is the measurable behavior or attribute portrayed in all the members of the population. Sometimes referred to as variable. For example, performance, market share and investment strategy etc.
3.1.2 Population Parameter
Definition
Population parameter is the characteristic or measurable behavior we want to study from the population, also referred to as the population characteristic. It is called so for we chose it from the population and not from the collected sample. There are several such population parameters/characteristics such as; population size, population average, population variance, and population standard deviation etc.
Illustration one
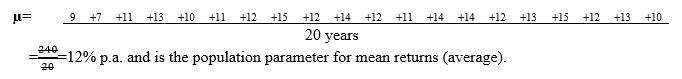
i). If the researcher want to study the population average (i.e. also known as expected, or mean), then that average is referred to as population parameter and it will be denoted as (µ, pronounced as mu).
ii). If the researcher wants to study the measures of dispersion behavior of a variable, he or she can use population standard deviation denoted as (δ, pronounced as sigma).
iii). If the researcher wants to study the measures of dispersion behavior of a variable, he or she can also use population variance denoted as (δ2, pronounced as variance of population).
iv). If the researcher wants to express the size of the population, he/she will use population size (N, pronounced as capital “N”).
Example 1
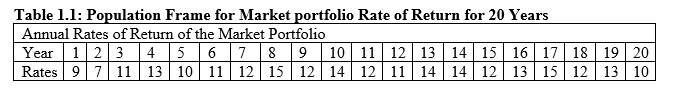
Suppose the annual return of a particular market portfolio you have invested in for the last 20 years is as shown in Table 1.1 below
Required
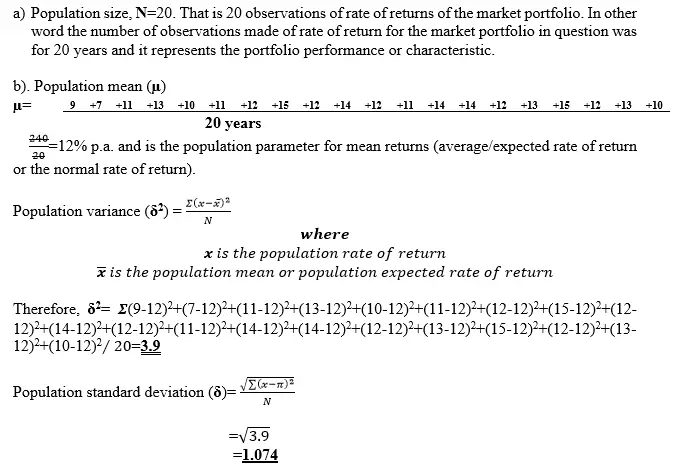
a). Population size (N)
b). The population mean (µ) (average/expected) parameter of per annum rate of return for the market portfolio
c). Variance (δ2) away from the population mean
d). Deviation (δ) away from the population mean
Solution
NOTE1 the following points
The population is the number of observations made for the rate of return of your market portfolio for the 20 years denoted as (N)
Population characteristic is the performance of the market portfolio
Assumption is that the size of the population is known or it is small
3.1.3 Sample Statistic
Definition
Sample statistic is the characteristic or measurable behavior we want to study from the collected sample, also referred to as the sample characteristic. It is called so for we chose it from the collected sample and not from the population. There are several such sample statistics/characteristics such as; There are several such population parameters/characteristics such as; sample size, sample average, sample variance, and sample standard deviation etc.
Illustration two
i). If the researcher want to study the sample average (i.e. also known as expected, or mean), then that average is referred to as sample statistic and it will be denoted as ( ).
).
ii). If the researcher wants to study the measures of dispersion behavior of a variable, he or she can use sample standard deviation denoted as (S).
iii). If the researcher wants to study the measures of dispersion behavior of a variable, he or she can also use sample variance denoted as (S2).
iv). If the researcher wants to express the size of the sample, he/she will use sample size (n).
Example 2
In example two, we will revisit the example one facts above only that the researcher feels that a population of 20 is too large and uneconomical to research on. So, he randomly selects 5 observations out of the total 20 observations in the data bank. This information is as indicated in Table 1.2 below with the selected rates being expressed in red font.
Table 1.2: Sample Frame for Market portfolio Rate of Return for 5 Years (fonts in Red)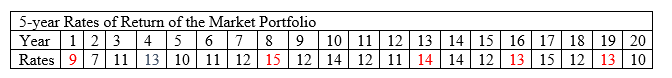
Required
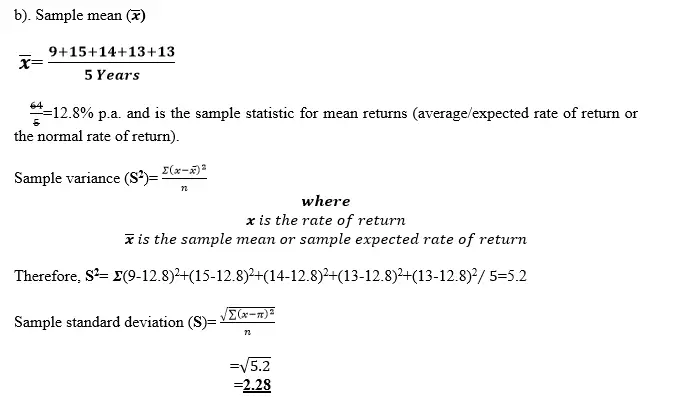
a). Sample size (n)
b). The Sample mean () (average/expected) statistic of per annum rate of return for the market portfolio
c). Variance (S2) away from the Sample mean
d). Deviation (S) away from the Sample on mean
Solution
NOTE2 the following points
The sample is the number of observations made for the rate of return of your market portfolio for the 5 years denoted as (n).
Sample characteristic is the performance of the 5-year selected portfolio returns.
Assumption is that the size of the population is unknown or it is very large.
Argument for null hypothesizing
4.1 Introduction
Null Hypothesizing is very important in decision-making. This is because management involves making decisions that utilize scarce resources to achieve some specific objectives. For example, if the management proclaim or postulate that “it is out of their significant efforts that there has been improved performance of the organization”, and may be they are demanding more compensatory payments, the stakeholders of the organization may decide to find out whether really this is the position so that they do not rashly increase their salaries or perquisites only to realize later that it was by chance (loosely refer to it as good luck) that they performed well that time.
Illustration one
Assume you have been engaging a portfolio manager to manage your assets (securities, namely common stock, preference shares, bonds etc.) for the last 20 years. You have been compensating him well up to recently (let say the last 5 years) when you realized that the market has been a vibrant one and whether you know how to invest or not, the returns are just good and you needed no portfolio manager. So the good performance that you have been witnessing is due to good tidings in the market and not necessarily that the portfolio manager has been applying any unique strategies to outperform.
On the other hand, the portfolio manager feels that he has been applying unique strategic investment tactics in managing the portfolio for the last 5 years and this justifies why he should continue enjoying the attractive remuneration.
To seek for statistical evidence whether his efforts are significant due to his unique strategies he has been applying or whether the significance performance witnessed was due to chance, (loosely refer to it as good luck and so i.e.- no true difference in the sample statistic and population parameter under consideration), a Null Hypothesis is incorporated to proof or disapprove that claim.
4.1.1 Step by Step Testing of Null Hypothesis
The following are the 6 key steps of testing the null hypothesis for the above postulation.
STEP 1: Set the Null Hypothesis
H0: There is no significant difference between Unique strategies used by the portfolio manager and the portfolio performance for the last 5 years”

Given the 20 Years Annual Return of Market Portfolio. The information is given in Table 1.3 which is an extract from the previous Table 1.1 in this article
Table 1.3: Population Frame for Market portfolio Rate of Return for 20 Years (Extract)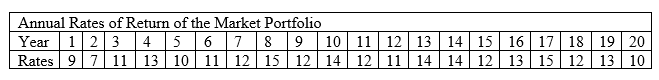
STEP 2: Compute the Population Mean, (If the Size of the Population Is Known) Or Refer to the Population Parameter if postulated.
STEP 3: Compute the Sample mean (i.e. Statistic). This is achieved by use of information in Table 1.4 which is an extract from the previous Table 1.2 in this article.
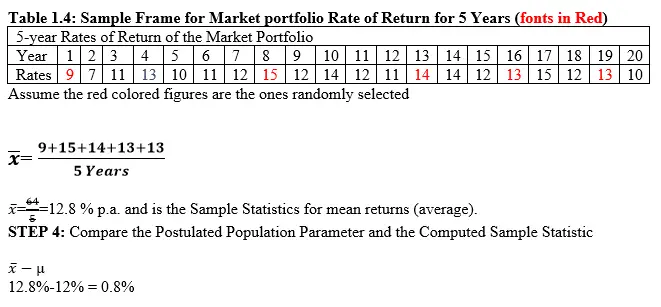
In this case, the difference between the sample statistic and the population parameter is 0.8%.
This is the most critical point where we wish to know whether this difference is significant or not
STEP 5: Make an Assumption that the Null Hypothesis is TRUE for the sake of Argument
That is, H0: There is no significant difference between Unique strategies used by the portfolio manager and the portfolio performance for the last 5 years”
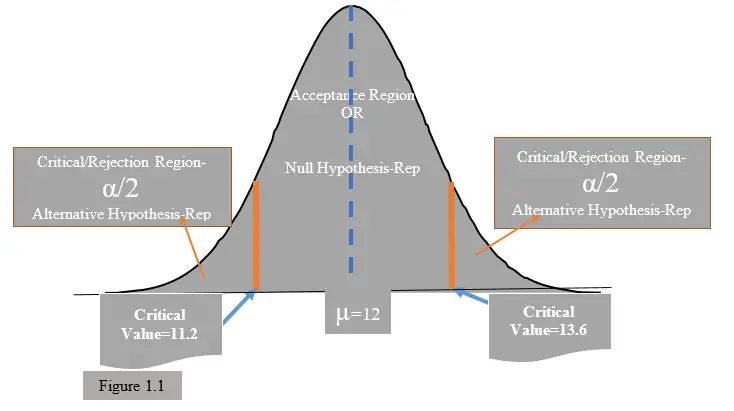
STEP 6: Set a Plausible (Logical Range) of the Hypothesized Population Parameter
In this step we make use of the computed difference between the population parameter postulated and the computed statistics. In the above example, it will range between
11.2 to 13.6 if the population average/mean is 12%. This implies that the sample statistic should lie within this range.
How did we arrive at this…..?
Remember that the computed
Population mean/average is 12.0
Sample mean/average is 12.8
Therefore;
The range, Lower boundary of 11.2 is derived at by 12- 0.8=11.2 and the
Upper boundary of 13.6 is derived at by 12.8+0.8=13.6
If the Sample Statistic lies between the range given (11.2 to 13.6) then we ACCEPT the Null Hypothesis. Which will mean that the difference witnessed in performance (i.e. the good or improved performance) of the portfolio is not statistically significant and was caused by chance
If the Sample Statistic lies outside the range given (11.2 to 13.6), in other words if it fall on the rejection region then we REJECT the Null Hypothesis. Which will mean that the difference witnessed in performance (i.e. the good performance) of the portfolio is statistically significant. That is, there is strong evidence of an observed difference that is too large to be explained solely by chance and therefore like in this case, it means that the portfolio manager unique strategic investment tactics has played a key role in the improved performance. This argument is presented in the normal distribution curve as shown in Figure 1.1 as follows;
Therefore, on Rejecting Null Hypothesis, we opt for the Alternate Hypothesis denoted as (H1).
Therefore, the information that is against the stated Null Hypothesis is captured in the alternative hypothesis (H1). For the above examples, the alternative hypothesis would be:
H1: “There is significant difference between Unique strategies used by the portfolio manager and the portfolio performance for the last 5 years”
Advantages of Null Hypothesis Testing
It is paramount to test hypothesis in a study. Why? There are several reasons for that. Namely;
- It is possible to assess the level of weakness or strength of your proposition you make over the outcome expected before data analysis is carried out.
- Null Hypothesis testing is the motherboard for good and reliable conceptual framework established on the basis of theoretical foundation which in turn help in making any data decisions for the population of interest.
- Null Hypothesis testing helps in generalizing the research findings gotten from sample data on the population.
- Null Hypothesis testing is a tool for assessing the statistical significance of data gotten from a sample so as to know whether to use it for conclusions of the research study or not.
- Null Hypothesis testing is a tool for evaluating the validity and reliability of research findings in any scientific study.
- Hypothesis testing links the primary theory and specific research questions in research to ensure that the results gotten are authentic.
Disadvantages of Null Hypothesis Testing
Limitations associated with null hypothesis testing are;
- It is difficulty to hypothesize-you see, the first step before testing a hypothesis is to hypothesize and any wrong hypothesizing will translate to invalid tests.
- P-value interpretation controversy for observation depends on the critical value criteria which is subjective and vary from one researcher to another. For instance, some researchers may consider 5% significant level and others 10% and the results gotten will vary significantly.
- Conceptualization problem- issues repeatedly come out in null hypothesis testing, particularly if the investigator amalgamates Fisher and Neyman-Pearson's approaches which are theoretically diverse.
- The researcher might ignore the estimation and confirmation throughout the recurrent experimentations when make an effort to focus on the statistical significance of the data.
- Publication biasness-null hypothesis testing may prompt biasness, especially when it requires statistical significance as a criterion for publication.